Statistiche di base
| Proprietari istituzionali | 80 total, 80 long only, 0 short only, 0 long/short - change of -8,99% MRQ |
| Allocazione media del portafoglio | 0.1113 % - change of 15,06% MRQ |
| Azioni istituzionali (Long) | 7.329.720 (ex 13D/G) - change of -0,17MM shares -2,28% MRQ |
| Valore istituzionale (Long) | $ 102.071 USD ($1000) |
Proprietà istituzionale e azionisti
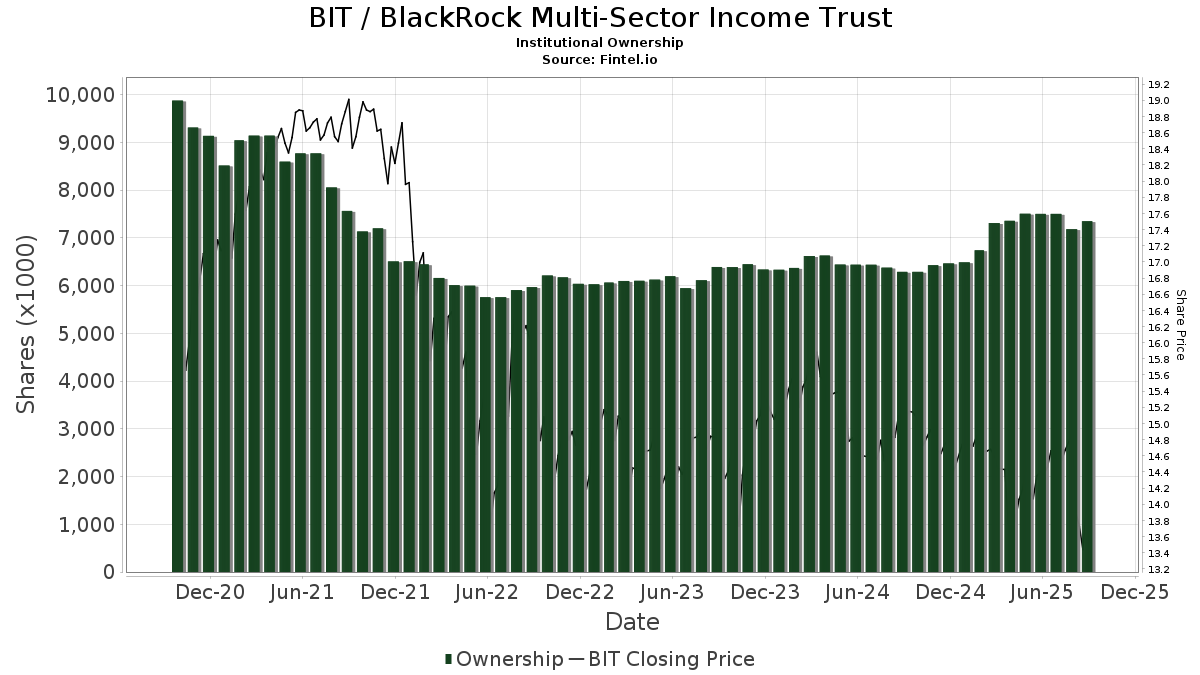
BlackRock Multi-Sector Income Trust (US:BIT) ha 80 proprietari istituzionali e azionisti che hanno presentato i moduli 13D/G o 13F alla Securities Exchange Commission (SEC). Queste istituzioni detengono un totale di 7,329,720 azioni. I maggiori azionisti includono Morgan Stanley, Cyndeo Wealth Partners, LLC, LPL Financial LLC, Ameriprise Financial Inc, Invesco Ltd., PCEF - Invesco CEF Income Composite ETF, Raymond James Financial Inc, Envestnet Asset Management Inc, UBS Group AG, and Guggenheim Capital Llc .
(BlackRock Multi-Sector Income Trust (NYSE:BIT) la struttura proprietaria istituzionale mostra le attuali posizioni nella società da parte di istituzioni e fondi, nonché le ultime variazioni nella dimensione della posizione. I principali azionisti possono essere singoli investitori, fondi comuni, hedge fund o istituzioni. L'allegato 13D indica che l'investitore detiene (o ha detenuto) più del 5% della società e intende (o intendeva) perseguire attivamente un cambiamento nella strategia aziendale. L'allegato 13G indica un investimento passivo superiore al 5%.
The share price as of September 2, 2025 is 13,57 / share. Previously, on September 3, 2024, the share price was 15,04 / share. This represents a decline of 9,77% over that period.
Indice del sentiment dei fondi
L'indice del sentiment dei fondi (anche noto come "indice di accumulo di proprietà") individua i titoli più acquistati dai fondi. È il risultato di un sofisticato modello quantitativo multi-fattore che identifica le società con i più alti livelli di accumulo istituzionale. Il modello utilizza una combinazione dell'aumento totale dei proprietari dichiarati, delle variazioni nelle allocazioni di portafoglio di tali proprietari e di altre metriche. Il punteggio varia da 0 a 100: i numeri più alti indicano un livello di accumulo superiore ad altre società, mentre 50 rappresenta la media.
Frequenza di aggiornamento: giornaliera
Consulta Ownership Explorer per visualizzare l'elenco delle aziende con il ranking più alto.
Rapporto put/call istituzionale
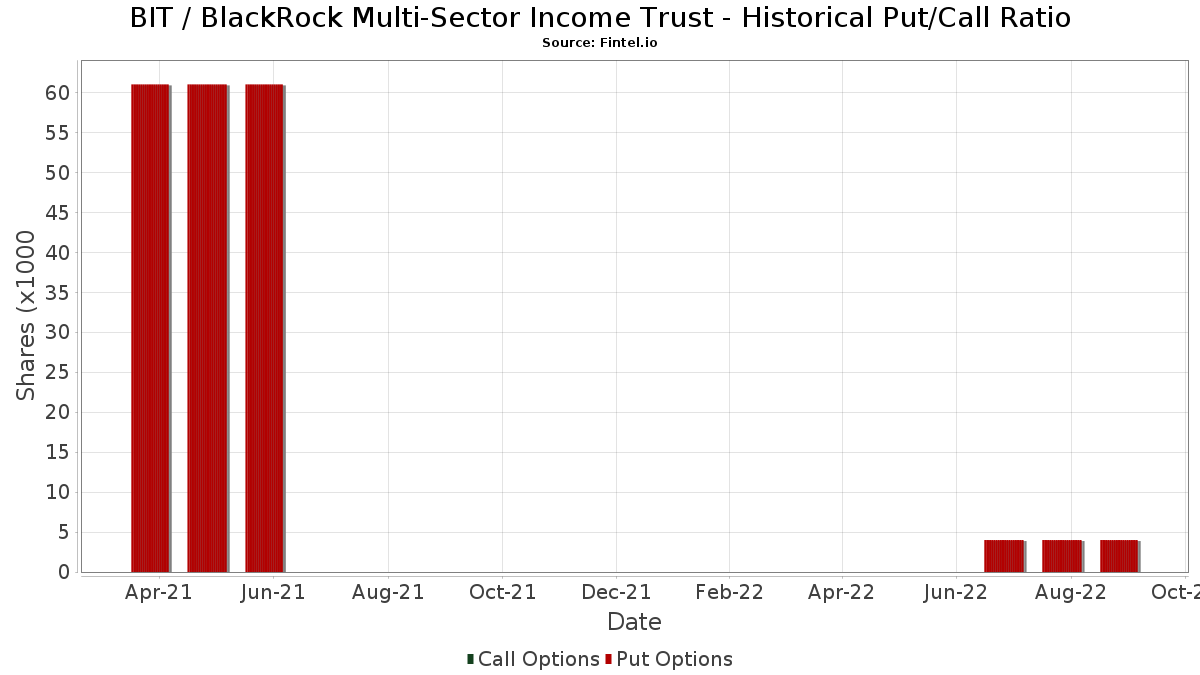
Oltre a segnalare le emissioni standard di titoli azionari e di debito, gli istituti con più di 100 milioni di asset in gestione devono anche dichiarare le loro partecipazioni in opzioni put e call. Poiché le opzioni put indicano generalmente un sentiment negativo e le opzioni call un sentiment positivo, possiamo avere un'idea del sentiment istituzionale complessivo attraverso il rapporto tra put e call. Il grafico a destra mostra il rapporto storico put/call per questo strumento.
L'utilizzo del rapporto put/call come indicatore del sentiment degli investitori consente di superare una delle principali lacune dell'utilizzo della proprietà istituzionale totale, ovvero il fatto che una quantità significativa di asset in gestione viene investita passivamente per seguire gli indici. Generalmente, i fondi a gestione passiva non acquistano opzioni, per cui il rapporto put/call riflette più fedelmente il sentiment dei fondi a gestione attiva.
Depositi 13F e NPORT
Le informazioni relative ai depositi 13F sono gratuite. Per accedere alle informazioni relative ai depositi NP è necessario un'abbonamento premium. Le righe verdi indicano le nuove posizioni. Le righe rosse indicano le posizioni chiuse. Fai clic sull'icona del link per visualizzare la cronologia completa delle transazioni.
Esegui l'upgrade
per sbloccare i dati premium ed esportarli in Excel ![]() .
.
| Data di deposito | Fonte | Investitore | Tipo | Prezzo medio (Stima) |
Azioni | Δ Azioni (%) |
Valore dichiarato ($ 1000) |
Δ Valore (%) |
Allocazione del portafoglio (%) |
|
|---|---|---|---|---|---|---|---|---|---|---|
| 2025-08-29 | NP | GraniteShares ETF Trust - GraniteShares HIPS US High Income ETF | 191.623 | 6,67 | 2.798 | 7,54 | ||||
| 2025-08-27 | NP | THRIVENT SERIES FUND INC - Thrivent Diversified Income Plus Portfolio Class A | 11.523 | 0,00 | 168 | 1,20 | ||||
| 2025-08-06 | 13F | Smh Capital Advisors Inc | 12.416 | -1,57 | 181 | -0,55 | ||||
| 2025-07-31 | 13F | Curio Wealth, Llc | 0 | -100,00 | 0 | |||||
| 2025-08-01 | 13F | Envestnet Asset Management Inc | 290.990 | 9,21 | 4.248 | 10,11 | ||||
| 2025-07-11 | 13F | Farther Finance Advisors, LLC | 391 | 0,00 | 6 | 0,00 | ||||
| 2025-08-14 | 13F | Stifel Financial Corp | 18.305 | 1,25 | 267 | 2,30 | ||||
| 2025-08-11 | 13F | Western Wealth Management, LLC | 11.609 | 0,00 | 169 | 0,60 | ||||
| 2025-08-14 | 13F | Comerica Bank | 6.950 | 7,75 | 101 | 8,60 | ||||
| 2025-08-05 | 13F | Fourth Dimension Wealth, LLC | 1.000 | 0,00 | 15 | 0,00 | ||||
| 2025-08-06 | 13F | Walkner Condon Financial Advisors LLC | 14.243 | 0,00 | 208 | 0,49 | ||||
| 2025-08-14 | 13F | Royal Bank Of Canada | 217.447 | -4,76 | 3.174 | -3,96 | ||||
| 2025-08-06 | 13F | Pekin Hardy Strauss, Inc. | 70.365 | 189,99 | 1.027 | 192,59 | ||||
| 2025-07-25 | NP | FCEF - First Trust CEF Income Opportunity ETF This fund is a listed as child fund of First Trust Advisors Lp and if that institution has disclosed ownership in this security, then these positions will not be double counted when calculating total shares and total value | 23.030 | 16,00 | 328 | 12,37 | ||||
| 2025-07-10 | 13F | Contravisory Investment Management, Inc. | 0 | -100,00 | 0 | |||||
| 2025-07-24 | 13F | Us Bancorp \de\ | 0 | -100,00 | 0 | |||||
| 2025-04-21 | 13F | ORG Partners LLC | 0 | -100,00 | 0 | |||||
| 2025-08-13 | 13F | WCG Wealth Advisors LLC | 29.375 | 429 | ||||||
| 2025-08-14 | 13F | Sunbelt Securities, Inc. | 0 | -100,00 | 0 | |||||
| 2025-05-15 | 13F | WPG Advisers, LLC | 0 | -100,00 | 0 | |||||
| 2025-08-12 | 13F | LPL Financial LLC | 514.672 | 71,95 | 7.514 | 73,37 | ||||
| 2025-07-11 | 13F/A | Umb Bank N A/mo | 500 | 0,00 | 7 | 0,00 | ||||
| 2025-07-24 | 13F | Cyndeo Wealth Partners, LLC | 668.770 | -8,87 | 9.764 | -8,11 | ||||
| 2025-08-14 | 13F | Mariner, LLC | 103.697 | 26,46 | 1.514 | 27,46 | ||||
| 2025-05-16 | 13F | Coppell Advisory Solutions LLC | 0 | -100,00 | 0 | |||||
| 2025-08-26 | 13F/A | Thrivent Financial For Lutherans | 152.795 | 0,00 | 2 | 0,00 | ||||
| 2025-08-08 | 13F | Cetera Investment Advisers | 59.446 | 3,22 | 868 | 4,08 | ||||
| 2025-07-22 | 13F | DAVENPORT & Co LLC | 29.345 | -8,99 | 428 | -8,15 | ||||
| 2025-08-06 | 13F | Golden State Wealth Management, LLC | 1.120 | 2,00 | 16 | 6,67 | ||||
| 2025-08-14 | 13F | LaSalle St. Investment Advisors, LLC | 0 | -100,00 | 0 | |||||
| 2025-08-14 | 13F | Wells Fargo & Company/mn | 89.094 | -13,48 | 1.301 | -12,81 | ||||
| 2025-08-14 | 13F | GWM Advisors LLC | 84.429 | 2,03 | 1.233 | 2,84 | ||||
| 2025-08-11 | 13F | Semus Wealth Partners LLC | 26.118 | -4,53 | 381 | -3,79 | ||||
| 2025-08-18 | 13F | Geneos Wealth Management Inc. | 500 | 0,00 | 7 | 0,00 | ||||
| 2025-05-14 | 13F | Jane Street Group, Llc | 0 | -100,00 | 0 | |||||
| 2025-07-17 | 13F | Janney Montgomery Scott LLC | 65.493 | 11,65 | 1 | |||||
| 2025-07-31 | 13F | Cambridge Investment Research Advisors, Inc. | 67.734 | -44,09 | 1 | -100,00 | ||||
| 2025-08-14 | 13F | Ameriprise Financial Inc | 435.963 | -28,88 | 6.365 | -28,17 | ||||
| 2025-08-07 | 13F | Readystate Asset Management Lp | 0 | -100,00 | 0 | |||||
| 2025-08-05 | 13F | GPS Wealth Strategies Group, LLC | 1.900 | 0,00 | 28 | 0,00 | ||||
| 2025-08-08 | 13F | Pnc Financial Services Group, Inc. | 500 | 0,00 | 7 | 0,00 | ||||
| 2025-08-01 | 13F | Gwn Securities Inc. | 14.620 | 213 | ||||||
| 2025-08-27 | NP | THRIVENT SERIES FUND INC - Thrivent Balanced Income Plus Portfolio Class A | 4.532 | 0,00 | 66 | 1,54 | ||||
| 2025-08-14 | 13F | CoreCap Advisors, LLC | 4.400 | -18,52 | 64 | -17,95 | ||||
| 2025-07-21 | 13F | Ameritas Advisory Services, LLC | 580 | 8 | ||||||
| 2025-08-07 | 13F | Allworth Financial LP | 100 | 0,00 | 1 | 0,00 | ||||
| 2025-08-06 | 13F | Wedbush Securities Inc | 14.491 | 0 | ||||||
| 2025-07-18 | 13F | Truist Financial Corp | 116.774 | 8,09 | 1.705 | 8,95 | ||||
| 2025-07-14 | 13F | AdvisorNet Financial, Inc | 1.045 | 15 | ||||||
| 2025-07-17 | 13F | GraniteShares Advisors LLC | 191.623 | 6,67 | 2.798 | 7,54 | ||||
| 2025-05-05 | 13F | Transce3nd, LLC | 0 | -100,00 | 0 | |||||
| 2025-08-13 | 13F | Advisor Group Holdings, Inc. | 102.304 | -17,30 | 1.494 | -16,64 | ||||
| 2025-07-23 | 13F | Clear Creek Financial Management, LLC | 0 | -100,00 | 0 | |||||
| 2025-08-13 | 13F | Northwestern Mutual Wealth Management Co | 9.980 | 0,00 | 146 | 0,69 | ||||
| 2025-04-30 | 13F | Ramiah Investment Group | 34.274 | 496 | ||||||
| 2025-08-27 | NP | AAHYX - Thrivent Diversified Income Plus Fund Class A | 18.346 | 0,00 | 268 | 0,75 | ||||
| 2025-07-10 | 13F | Wealth Enhancement Advisory Services, Llc | 0 | -100,00 | 0 | |||||
| 2025-08-14 | 13F/A | Rockefeller Capital Management L.P. | 46.484 | 12,04 | 679 | 13,00 | ||||
| 2025-08-14 | 13F | Raymond James Financial Inc | 344.499 | -8,64 | 5.030 | -7,89 | ||||
| 2025-08-13 | 13F | Cerity Partners LLC | 53.209 | 0,01 | 777 | 0,78 | ||||
| 2025-08-13 | 13F | Guggenheim Capital Llc | 271.427 | 65,99 | 3.963 | 67,38 | ||||
| 2025-08-13 | 13F | First Trust Advisors Lp | 61.478 | 7,09 | 898 | 7,94 | ||||
| 2025-08-11 | 13F | HighTower Advisors, LLC | 12.510 | -4,57 | 183 | -3,70 | ||||
| 2025-07-29 | 13F | Private Trust Co Na | 5.242 | 0,00 | 77 | 1,33 | ||||
| 2025-08-27 | NP | THRIVENT SERIES FUND INC - Thrivent Opportunity Income Plus Portfolio Class A | 8.813 | 0,00 | 129 | 0,79 | ||||
| 2025-07-16 | 13F | ORG Wealth Partners, LLC | 3.343 | 0,00 | 49 | 0,00 | ||||
| 2025-07-23 | 13F | Elm3 Financial Group, LLC | 27.261 | 6,76 | 398 | 7,86 | ||||
| 2025-08-05 | 13F | Shaker Financial Services, LLC | 0 | -100,00 | 0 | |||||
| 2025-08-15 | 13F | Morgan Stanley | 1.286.694 | -4,82 | 18.786 | -4,03 | ||||
| 2025-06-26 | NP | AAINX - Thrivent Opportunity Income Plus Fund Class A | 39.295 | 0,00 | 552 | -4,83 | ||||
| 2025-07-08 | 13F | Webster Bank, N. A. | 2.255 | 0,00 | 33 | 0,00 | ||||
| 2025-08-12 | 13F | Steward Partners Investment Advisory, Llc | 100.237 | 13,49 | 1.463 | 14,48 | ||||
| 2025-08-13 | 13F | Invesco Ltd. | 351.527 | -1,00 | 5.132 | -0,18 | ||||
| 2025-07-29 | 13F | Stratos Wealth Partners, LTD. | 14.385 | 210 | ||||||
| 2025-08-04 | 13F | Spire Wealth Management | 10.000 | 0,00 | 146 | 1,39 | ||||
| 2025-07-25 | 13F | Concurrent Investment Advisors, LLC | 14.069 | 15,13 | 205 | 16,48 | ||||
| 2025-08-11 | 13F | Elequin Capital Lp | 0 | -100,00 | 0 | |||||
| 2025-08-11 | 13F | Principal Securities, Inc. | 9.165 | 1,04 | 134 | 0,76 | ||||
| 2025-08-15 | 13F | Tower Research Capital LLC (TRC) | 7 | 0 | ||||||
| 2025-07-25 | 13F | Atria Wealth Solutions, Inc. | 0 | -100,00 | 0 | |||||
| 2025-07-28 | NP | PCEF - Invesco CEF Income Composite ETF This fund is a listed as child fund of Invesco Ltd. and if that institution has disclosed ownership in this security, then these positions will not be double counted when calculating total shares and total value | 348.196 | 2,15 | 4.955 | -1,06 | ||||
| 2025-08-14 | 13F | UBS Group AG | 280.667 | -0,20 | 4.098 | 0,61 | ||||
| 2025-04-09 | 13F | St Germain D J Co Inc | 0 | 0 | ||||||
| 2025-08-07 | 13F | Evoke Wealth, Llc | 79.506 | 0,00 | 1.161 | 0,78 | ||||
| 2025-08-14 | 13F | Snowden Capital Advisors LLC | 29.688 | -2,08 | 433 | -1,37 | ||||
| 2025-06-26 | NP | AABFX - Thrivent Balanced Income Plus Fund Class A | 4.902 | 0,00 | 69 | -5,56 | ||||
| 2025-04-16 | 13F | West Oak Capital, LLC | 0 | -100,00 | 0 | |||||
| 2025-08-05 | 13F | Bank of New York Mellon Corp | 132.289 | 1.931 | ||||||
| 2025-08-19 | 13F | Advisory Services Network, LLC | 21.472 | -4,45 | 315 | -3,08 | ||||
| 2025-07-14 | 13F | E&G Advisors, LP | 78.400 | -1,38 | 1.145 | -0,61 | ||||
| 2025-08-05 | 13F | Westside Investment Management, Inc. | 0 | -100,00 | 0 | |||||
| 2025-08-04 | 13F | Creekmur Asset Management LLC | 4.719 | 161,44 | 69 | 161,54 | ||||
| 2025-07-14 | 13F | U.S. Capital Wealth Advisors, LLC | 0 | -100,00 | 0 | |||||
| 2025-08-06 | 13F | Commonwealth Equity Services, Llc | 33.719 | 4,05 | 0 | |||||
| 2025-08-12 | 13F | Proequities, Inc. | 0 | 0 | ||||||
| 2025-07-07 | 13F | First Citizens Financial Corp | 15.603 | 0,00 | 228 | 0,89 | ||||
| 2025-05-12 | 13F | Virtu Financial LLC | 0 | -100,00 | 0 | |||||
| 2025-08-12 | 13F | Founders Financial Alliance, LLC | 0 | -100,00 | 0 | |||||
| 2025-04-24 | 13F | Primoris Wealth Advisors, Llc | 0 | -100,00 | 0 | |||||
| 2025-05-12 | 13F | Wolverine Asset Management Llc | 0 | -100,00 | 0 | |||||
| 2025-05-14 | 13F | Landscape Capital Management, L.l.c. | 0 | -100,00 | 0 | |||||
| 2025-07-28 | 13F | Harbour Investments, Inc. | 1.276 | 0,00 | 19 | 0,00 | ||||
| 2025-05-13 | 13F | Verus Capital Partners, Llc | 0 | -100,00 | 0 | |||||
| 2025-08-14 | 13F | EP Wealth Advisors, Inc. | 10.479 | -4,55 | 153 | -3,80 | ||||
| 2025-08-14 | 13F | Bank Of America Corp /de/ | 216.549 | -1,94 | 3.162 | -1,13 | ||||
| 2025-08-11 | 13F | Private Advisor Group, LLC | 54.061 | -17,15 | 789 | -16,42 | ||||
| 2025-08-12 | 13F | Boreal Capital Management LLC | 0 | 455 | ||||||
| 2025-08-14 | 13F | Wiley Bros.-aintree Capital, Llc | 13.108 | 6,60 | 191 | 7,91 | ||||
| 2025-08-13 | 13F | StoneX Group Inc. | 0 | -100,00 | 0 | -100,00 |