Statistiche di base
| Proprietari istituzionali | 96 total, 94 long only, 1 short only, 1 long/short - change of -7,69% MRQ |
| Allocazione media del portafoglio | 0.0453 % - change of -4,30% MRQ |
| Azioni istituzionali (Long) | 748.561 (ex 13D/G) - change of -0,09MM shares -10,60% MRQ |
| Valore istituzionale (Long) | $ 109.696 USD ($1000) |
Proprietà istituzionale e azionisti
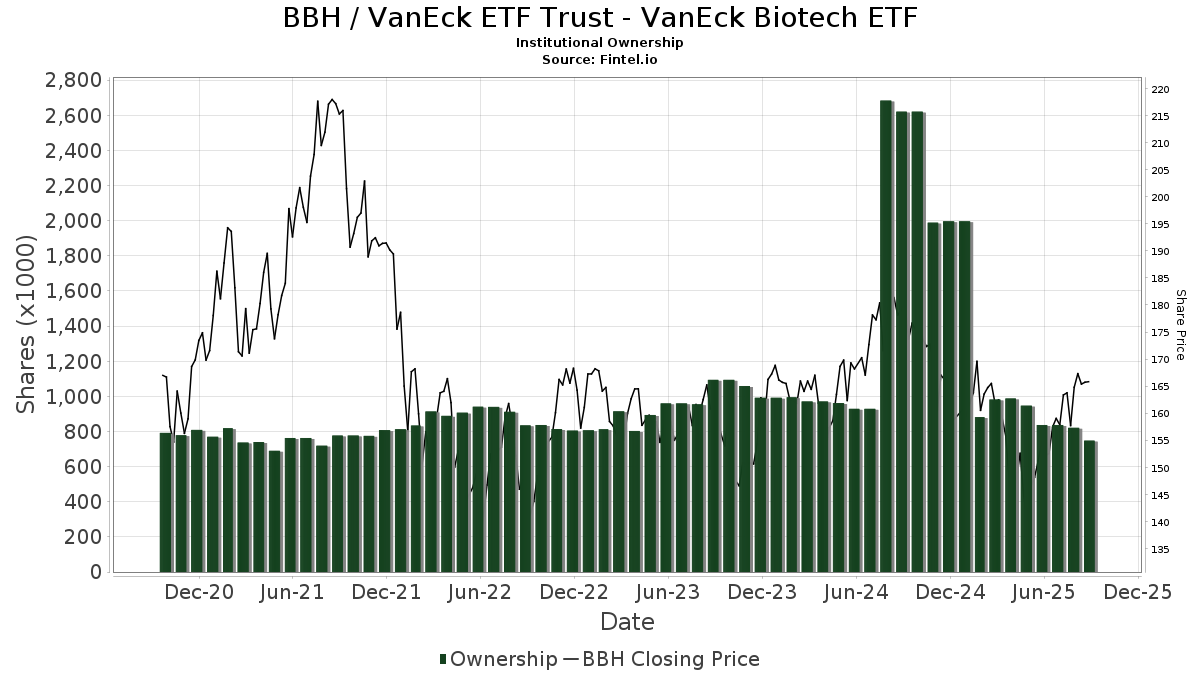
VanEck ETF Trust - VanEck Biotech ETF (US:BBH) ha 96 proprietari istituzionali e azionisti che hanno presentato i moduli 13D/G o 13F alla Securities Exchange Commission (SEC). Queste istituzioni detengono un totale di 748,561 azioni. I maggiori azionisti includono Goldman Sachs Group Inc, Miller Investment Management, LP, Raymond James Financial Inc, TD Waterhouse Canada Inc., Bank Of America Corp /de/, Morgan Stanley, Wells Fargo & Company/mn, LPL Financial LLC, UBS Group AG, and Royal Bank Of Canada .
(VanEck ETF Trust - VanEck Biotech ETF (NasdaqGM:BBH) la struttura proprietaria istituzionale mostra le attuali posizioni nella società da parte di istituzioni e fondi, nonché le ultime variazioni nella dimensione della posizione. I principali azionisti possono essere singoli investitori, fondi comuni, hedge fund o istituzioni. L'allegato 13D indica che l'investitore detiene (o ha detenuto) più del 5% della società e intende (o intendeva) perseguire attivamente un cambiamento nella strategia aziendale. L'allegato 13G indica un investimento passivo superiore al 5%.
The share price as of September 12, 2025 is 165,71 / share. Previously, on September 13, 2024, the share price was 181,20 / share. This represents a decline of 8,55% over that period.
Indice del sentiment dei fondi
L'indice del sentiment dei fondi (anche noto come "indice di accumulo di proprietà") individua i titoli più acquistati dai fondi. È il risultato di un sofisticato modello quantitativo multi-fattore che identifica le società con i più alti livelli di accumulo istituzionale. Il modello utilizza una combinazione dell'aumento totale dei proprietari dichiarati, delle variazioni nelle allocazioni di portafoglio di tali proprietari e di altre metriche. Il punteggio varia da 0 a 100: i numeri più alti indicano un livello di accumulo superiore ad altre società, mentre 50 rappresenta la media.
Frequenza di aggiornamento: giornaliera
Consulta Ownership Explorer per visualizzare l'elenco delle aziende con il ranking più alto.
Rapporto put/call istituzionale
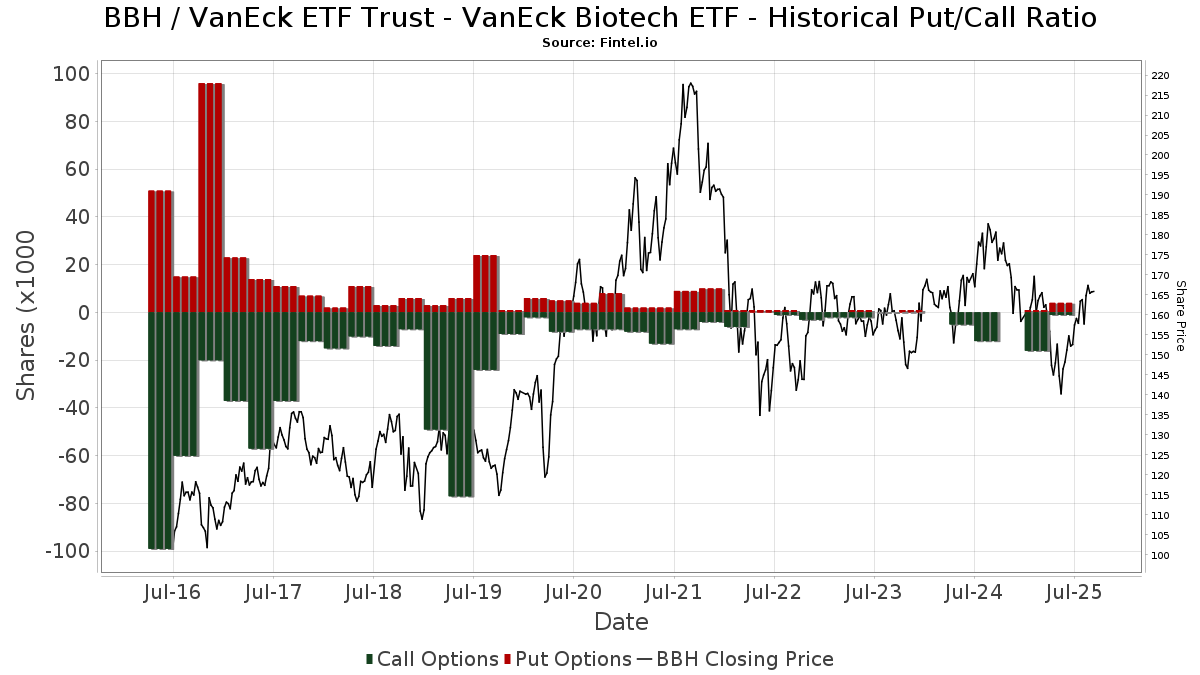
Oltre a segnalare le emissioni standard di titoli azionari e di debito, gli istituti con più di 100 milioni di asset in gestione devono anche dichiarare le loro partecipazioni in opzioni put e call. Poiché le opzioni put indicano generalmente un sentiment negativo e le opzioni call un sentiment positivo, possiamo avere un'idea del sentiment istituzionale complessivo attraverso il rapporto tra put e call. Il grafico a destra mostra il rapporto storico put/call per questo strumento.
L'utilizzo del rapporto put/call come indicatore del sentiment degli investitori consente di superare una delle principali lacune dell'utilizzo della proprietà istituzionale totale, ovvero il fatto che una quantità significativa di asset in gestione viene investita passivamente per seguire gli indici. Generalmente, i fondi a gestione passiva non acquistano opzioni, per cui il rapporto put/call riflette più fedelmente il sentiment dei fondi a gestione attiva.
Depositi 13F e NPORT
Le informazioni relative ai depositi 13F sono gratuite. Per accedere alle informazioni relative ai depositi NP è necessario un'abbonamento premium. Le righe verdi indicano le nuove posizioni. Le righe rosse indicano le posizioni chiuse. Fai clic sull'icona del link per visualizzare la cronologia completa delle transazioni.
Esegui l'upgrade
per sbloccare i dati premium ed esportarli in Excel ![]() .
.
| Data di deposito | Fonte | Investitore | Tipo | Prezzo medio (Stima) |
Azioni | Δ Azioni (%) |
Valore dichiarato ($ 1000) |
Δ Valore (%) |
Allocazione del portafoglio (%) |
|
|---|---|---|---|---|---|---|---|---|---|---|
| 2025-08-14 | 13F | UBS Group AG | 21.223 | -23,82 | 3.253 | -25,78 | ||||
| 2025-07-15 | 13F | North Star Investment Management Corp. | 373 | 0,00 | 57 | -1,72 | ||||
| 2025-08-01 | 13F | Belvedere Trading LLC | Call | 0 | -100,00 | 0 | -100,00 | |||
| 2025-08-08 | 13F | Larson Financial Group LLC | 70 | 11 | ||||||
| 2025-05-20 | 13F/A | Colony Group, LLC | 0 | -100,00 | 0 | -100,00 | ||||
| 2025-08-13 | 13F | Continuum Advisory, LLC | 0 | -100,00 | 0 | -100,00 | ||||
| 2025-07-31 | 13F | Wealthfront Advisers Llc | 5.945 | -18,02 | 911 | -20,09 | ||||
| 2025-07-21 | 13F | HighMark Wealth Management LLC | 80 | 0,00 | 12 | 0,00 | ||||
| 2025-08-13 | 13F | Jones Financial Companies Lllp | 2.570 | -9,35 | 393 | -12,69 | ||||
| 2025-07-14 | 13F | Pacifica Partners Inc. | 25 | 0,00 | 4 | 0,00 | ||||
| 2025-08-14 | 13F | Peapack Gladstone Financial Corp | 7.438 | -8,79 | 1 | 0,00 | ||||
| 2025-08-15 | 13F | CI Private Wealth, LLC | 13.290 | 63,47 | 2.037 | 59,27 | ||||
| 2025-07-31 | 13F | Conservest Capital Advisors, Inc. | 15.713 | -9,85 | 2.408 | -12,18 | ||||
| 2025-08-05 | 13F | Bank Of Montreal /can/ | 287 | 0,00 | 44 | -4,44 | ||||
| 2025-07-29 | 13F | Aspiriant, Llc | 3.727 | -12,04 | 571 | -14,26 | ||||
| 2025-07-30 | 13F | Whittier Trust Co | 100 | 0,00 | 15 | 0,00 | ||||
| 2025-08-07 | 13F | Allworth Financial LP | 120 | 0,00 | 18 | 0,00 | ||||
| 2025-05-13 | 13F | Tocqueville Asset Management L.p. | 0 | -100,00 | 0 | -100,00 | ||||
| 2025-08-18 | 13F | Tyler-Stone Wealth Management | 1.308 | 0,00 | 201 | -2,44 | ||||
| 2025-08-14 | 13F | Stifel Financial Corp | 6.756 | -0,73 | 1.036 | -3,27 | ||||
| 2025-08-14 | 13F | Goldman Sachs Group Inc | 109.971 | 3,57 | 16.856 | 0,90 | ||||
| 2025-04-29 | 13F | Truist Financial Corp | 0 | -100,00 | 0 | |||||
| 2025-07-28 | 13F | Harbour Investments, Inc. | 235 | 0,00 | 36 | 0,00 | ||||
| 2025-07-30 | 13F | Financial Perspectives, Inc | 88 | 0,00 | 13 | 0,00 | ||||
| 2025-08-12 | 13F | MAI Capital Management | 265 | 0,00 | 41 | -2,44 | ||||
| 2025-08-01 | 13F | Strategic Financial Services, Inc, | 0 | -100,00 | 0 | -100,00 | ||||
| 2025-07-25 | 13F | NorthRock Partners, LLC | 756 | 0,00 | 116 | -2,54 | ||||
| 2025-08-15 | 13F | Tower Research Capital LLC (TRC) | 2.997 | -28,44 | 459 | -30,24 | ||||
| 2025-09-04 | 13F/A | Advisor Group Holdings, Inc. | 1.465 | 87,10 | 225 | 82,11 | ||||
| 2025-05-15 | 13F | Integrated Wealth Concepts LLC | 0 | -100,00 | 0 | |||||
| 2025-07-28 | 13F | BRYN MAWR TRUST Co | 1.032 | 1,78 | 158 | -0,63 | ||||
| 2025-05-05 | 13F | Private Advisor Group, LLC | 0 | -100,00 | 0 | |||||
| 2025-08-13 | 13F | Truvestments Capital Llc | 250 | 0,00 | 38 | -2,56 | ||||
| 2025-08-08 | 13F | Cetera Investment Advisers | 2.031 | -34,36 | 311 | -36,01 | ||||
| 2025-07-25 | 13F | Cwm, Llc | 225 | 0,00 | 0 | |||||
| 2025-08-13 | 13F | Navis Wealth Advisors, LLC | 3.978 | 0,00 | 610 | -2,56 | ||||
| 2025-08-11 | 13F | Banque Cantonale Vaudoise | 1.206 | 0 | ||||||
| 2025-07-21 | 13F | Ameritas Advisory Services, LLC | 371 | 57 | ||||||
| 2025-08-12 | 13F | Proequities, Inc. | 0 | 0 | ||||||
| 2025-04-23 | 13F | Oppenheimer & Co Inc | 0 | -100,00 | 0 | |||||
| 2025-08-18 | 13F | Hollencrest Capital Management | 70 | 0,00 | 11 | -9,09 | ||||
| 2025-08-12 | 13F | Coldstream Capital Management Inc | 0 | -100,00 | 0 | |||||
| 2025-04-29 | 13F | Envestnet Asset Management Inc | 0 | -100,00 | 0 | |||||
| 2025-08-04 | 13F | Assetmark, Inc | 0 | -100,00 | 0 | |||||
| 2025-08-06 | 13F | Commonwealth Equity Services, Llc | 10.758 | -62,40 | 2 | -75,00 | ||||
| 2025-08-14 | 13F | Wells Fargo & Company/mn | 27.471 | -55,63 | 4.211 | -56,78 | ||||
| 2025-08-12 | 13F | Manchester Capital Management LLC | 300 | 0,00 | 46 | -4,26 | ||||
| 2025-05-12 | 13F | Independent Advisor Alliance | 0 | -100,00 | 0 | |||||
| 2025-08-14 | 13F | Bank Of America Corp /de/ | 52.466 | 17,72 | 8.042 | 14,71 | ||||
| 2025-08-11 | 13F | Principal Securities, Inc. | 72 | 0,00 | 11 | 0,00 | ||||
| 2025-08-14 | 13F | Boston Private Wealth Llc | 0 | -100,00 | 0 | |||||
| 2025-07-18 | 13F | Founders Capital Management | 100 | 0,00 | 15 | 0,00 | ||||
| 2025-08-18 | 13F/A | National Bank Of Canada /fi/ | 25 | 0,00 | 4 | 0,00 | ||||
| 2025-08-14 | 13F | GWM Advisors LLC | 39 | 0,00 | 6 | -16,67 | ||||
| 2025-07-11 | 13F | Farther Finance Advisors, LLC | 121 | 0,00 | 19 | 0,00 | ||||
| 2025-08-15 | 13F | Morgan Stanley | 31.311 | -59,32 | 4.799 | -60,37 | ||||
| 2025-08-11 | 13F | Citigroup Inc | 5.482 | 840 | ||||||
| 2025-08-14 | 13F | Aspen Grove Capital, LLC | 9.978 | 0,00 | 1.529 | -2,55 | ||||
| 2025-08-12 | 13F | BlackRock, Inc. | 70 | 11 | ||||||
| 2025-07-18 | 13F | Institute for Wealth Management, LLC. | 7.581 | 0,00 | 1.162 | -2,52 | ||||
| 2025-08-12 | 13F | Ameritas Investment Partners, Inc. | 30 | 0,00 | 5 | 0,00 | ||||
| 2025-08-08 | 13F | Altfest L J & Co Inc | 8.530 | 11,34 | 1.307 | 8,46 | ||||
| 2025-08-07 | 13F | Commerce Bank | 0 | -100,00 | 0 | |||||
| 2025-08-12 | 13F | CIBC Private Wealth Group, LLC | 4.958 | 0,00 | 760 | 9,37 | ||||
| 2025-08-05 | 13F | Simplex Trading, Llc | 0 | -100,00 | 0 | |||||
| 2025-05-15 | 13F | Edmond De Rothschild Holding S.a. | 0 | -100,00 | 0 | |||||
| 2025-07-15 | 13F | EWG Elevate Inc. | 2.371 | 363 | ||||||
| 2025-07-24 | 13F | Us Bancorp \de\ | 148 | 0,00 | 23 | -4,35 | ||||
| 2025-08-12 | 13F | Global Retirement Partners, LLC | 124 | 0,00 | 19 | -5,26 | ||||
| 2025-07-23 | 13F | 1 North Wealth Services Llc | 78 | 0,00 | 12 | -8,33 | ||||
| 2025-08-06 | 13F | Miller Investment Management, LP | 81.432 | -11,30 | 12.482 | -13,58 | ||||
| 2025-08-01 | 13F | Belvedere Trading LLC | Put | 1.800 | 276 | |||||
| 2025-07-21 | 13F | Consolidated Investment Group LLC | 0 | -100,00 | 0 | |||||
| 2025-08-14 | 13F | CoreCap Advisors, LLC | 190 | 0,00 | 29 | 0,00 | ||||
| 2025-08-12 | 13F | Jpmorgan Chase & Co | 4.296 | -41,47 | 658 | -42,98 | ||||
| 2025-05-09 | 13F | Commonwealth Retirement Investments LLC | 0 | -100,00 | 0 | |||||
| 2025-08-08 | 13F | SBI Securities Co., Ltd. | 432 | 0,23 | 66 | -1,49 | ||||
| 2025-05-14 | 13F | Flow Traders U.s. Llc | 0 | -100,00 | 0 | |||||
| 2025-08-14 | 13F | Jane Street Group, Llc | 0 | -100,00 | 0 | |||||
| 2025-08-15 | 13F | Kestra Advisory Services, LLC | 3.528 | -2,84 | 541 | -5,43 | ||||
| 2025-08-13 | 13F | Blue Fin Capital, Inc. | 1.570 | 0,00 | 241 | -2,44 | ||||
| 2025-07-17 | 13F | Janney Montgomery Scott LLC | 3.065 | 0,00 | 0 | |||||
| 2025-08-14 | 13F | Paragon Private Wealth Management, LLC | 4.140 | 635 | ||||||
| 2025-08-11 | 13F | HighTower Advisors, LLC | 9.622 | -2,39 | 1.475 | -4,90 | ||||
| 2025-05-19 | 13F/A | Kovitz Investment Group Partners, LLC | 0 | -100,00 | 0 | -100,00 | ||||
| 2025-08-01 | 13F | Red Lighthouse Investment Management, Llc | 0 | -100,00 | 0 | |||||
| 2025-07-31 | 13F | United Community Bank | 0 | -100,00 | 0 | |||||
| 2025-08-11 | 13F | Tidemark, LLC | 207 | 0,00 | 32 | -3,12 | ||||
| 2025-09-04 | 13F | ZynergyRetirementPlanningLLC | 0 | -100,00 | 0 | |||||
| 2025-08-11 | 13F | TD Waterhouse Canada Inc. | 64.736 | 0,04 | 10.050 | 0,89 | ||||
| 2025-05-15 | 13F | Two Sigma Securities, Llc | 0 | -100,00 | 0 | -100,00 | ||||
| 2025-08-14 | 13F/A | Rockefeller Capital Management L.P. | 11.811 | 2,55 | 1.811 | -0,11 | ||||
| 2025-08-14 | 13F | Ameriprise Financial Inc | 7.424 | -2,26 | 1.138 | -4,85 | ||||
| 2025-07-24 | 13F | Blair William & Co/il | 425 | 0,00 | 65 | -1,52 | ||||
| 2025-05-15 | 13F | Two Sigma Investments, Lp | 0 | -100,00 | 0 | |||||
| 2025-08-12 | 13F | LPL Financial LLC | 22.295 | -7,78 | 3.417 | -10,15 | ||||
| 2025-07-17 | 13F | Coastline Trust Co | 190 | 0,00 | 29 | 0,00 | ||||
| 2025-08-13 | 13F | Cerity Partners LLC | 5.795 | 0,75 | 888 | -1,77 | ||||
| 2025-07-30 | 13F | Pacific Sun Financial Corp | 4.393 | -8,92 | 673 | -11,21 | ||||
| 2025-04-28 | 13F | Strategic Financial Concepts, LLC | 0 | -100,00 | 0 | -100,00 | ||||
| 2025-04-25 | 13F | Westside Investment Management, Inc. | 0 | -100,00 | 0 | -100,00 | ||||
| 2025-08-14 | 13F | Royal Bank Of Canada | 19.002 | 5,44 | 2.913 | 2,75 | ||||
| 2025-07-10 | 13F | Wealth Enhancement Advisory Services, Llc | 2.270 | 0,00 | 358 | 0,00 | ||||
| 2025-08-14 | 13F | Raymond James Financial Inc | 67.940 | 245,87 | 10.414 | 236,99 | ||||
| 2025-08-04 | 13F | Flagship Harbor Advisors, Llc | 2.460 | 12,90 | 377 | 9,94 | ||||
| 2025-08-14 | 13F | CIBC World Markets Inc. | 0 | -100,00 | 0 | |||||
| 2025-08-14 | 13F | Cardiff Park Advisors, Llc | 35 | 0,00 | 5 | 0,00 | ||||
| 2025-07-11 | 13F/A | Umb Bank N A/mo | 900 | 0,00 | 138 | -2,84 | ||||
| 2025-08-06 | 13F | Texas Yale Capital Corp. | 2.085 | 0,00 | 320 | -2,74 | ||||
| 2025-07-30 | 13F | Bleakley Financial Group, LLC | 18.980 | 2.909 | ||||||
| 2025-08-19 | 13F | Anchor Investment Management, LLC | 160 | 0,00 | 25 | -4,00 | ||||
| 2025-07-24 | 13F | Robertson Stephens Wealth Management, LLC | 1.402 | 3,70 | 215 | 0,94 | ||||
| 2025-08-12 | 13F | Boston Research & Management Inc | 10.812 | -4,41 | 2 | 0,00 | ||||
| 2025-08-11 | 13F | FSA Wealth Management LLC | 305 | 0,00 | 47 | -2,13 | ||||
| 2025-08-14 | 13F | Comerica Bank | 675 | 0,00 | 103 | -2,83 | ||||
| 2025-08-07 | 13F | LFA - Lugano Financial Advisors SA | 310 | 0,00 | 48 | -2,08 | ||||
| 2025-08-12 | 13F | Atlas Capital Advisors Llc | 5.700 | 0,00 | 874 | -2,57 | ||||
| 2025-08-08 | 13F | Creative Planning | 1.376 | -21,06 | 211 | -23,36 | ||||
| 2025-08-14 | 13F | Susquehanna International Group, Llp | Put | 2.400 | 84,62 | 368 | 79,90 | |||
| 2025-08-14 | 13F | Susquehanna International Group, Llp | 4.943 | -12,61 | 758 | -14,85 | ||||
| 2025-08-08 | 13F | Pnc Financial Services Group, Inc. | 4.000 | 0,00 | 613 | -2,54 | ||||
| 2025-08-14 | 13F | Williams Jones Wealth Management, LLC. | 2.200 | 0,00 | 337 | -2,60 | ||||
| 2025-07-24 | 13F | Cyndeo Wealth Partners, LLC | 0 | -100,00 | 0 | |||||
| 2025-08-13 | 13F | Northwestern Mutual Wealth Management Co | 1.508 | -93,26 | 231 | -93,43 | ||||
| 2025-08-14 | 13F | Fmr Llc | 332 | 0,91 | 51 | -1,96 | ||||
| 2025-08-14 | 13F | Susquehanna International Group, Llp | Call | 1.800 | -86,76 | 276 | -87,14 | |||
| 2025-08-14 | 13F | Citadel Advisors Llc | 8.160 | 223,55 | 1.251 | 215,66 | ||||
| 2025-08-14 | 13F | Qube Research & Technologies Ltd | 24 | 0,00 | 4 | 0,00 | ||||
| 2025-07-15 | 13F | Mather Group, Llc. | 0 | -100,00 | 0 | |||||
| 2025-07-24 | 13F | Ronald Blue Trust, Inc. | 43 | 7 | ||||||
| 2025-07-09 | 13F | Hummer Financial Advisory Services Inc | 1.410 | 0,00 | 216 | -2,26 |