Statistiche di base
| Proprietari istituzionali | 155 total, 154 long only, 1 short only, 0 long/short - change of 3,70% MRQ |
| Allocazione media del portafoglio | 0.1464 % - change of -5,29% MRQ |
| Azioni istituzionali (Long) | 69.959.846 (ex 13D/G) - change of 2,70MM shares 7,39% MRQ |
| Valore istituzionale (Long) | $ 191.929 USD ($1000) |
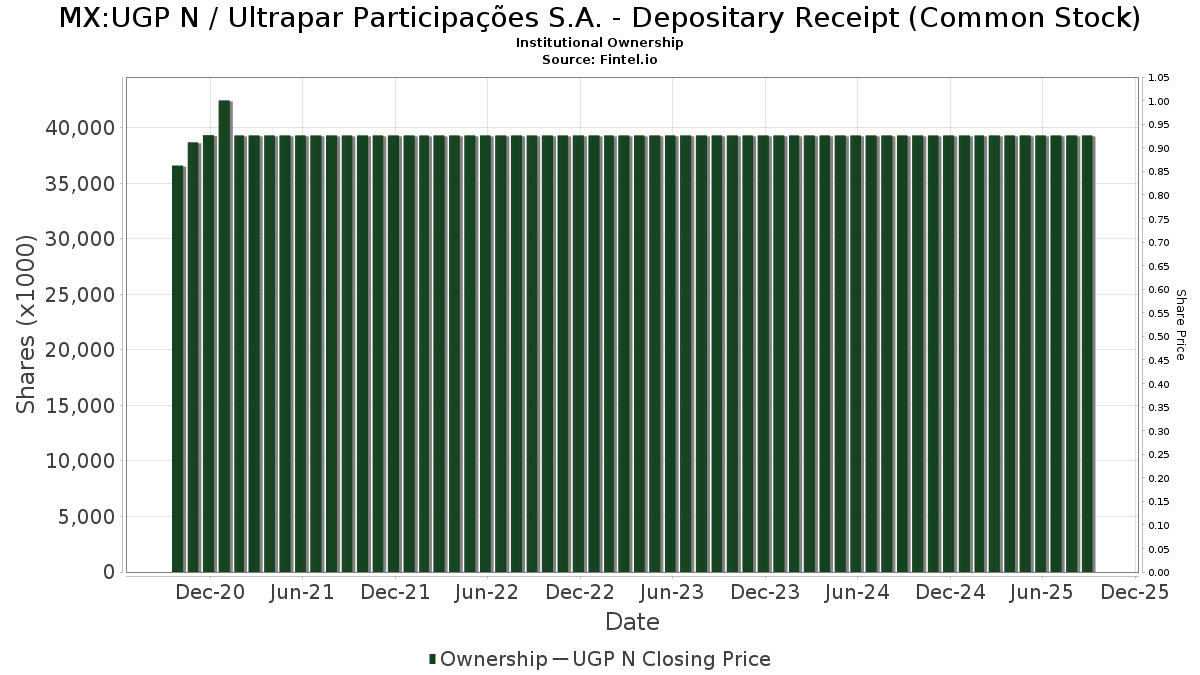
Proprietà istituzionale e azionisti
Ultrapar Participações S.A. - Depositary Receipt (Common Stock) (MX:UGP N) ha 155 proprietari istituzionali e azionisti che hanno presentato i moduli 13D/G o 13F alla Securities Exchange Commission (SEC). Queste istituzioni detengono un totale di 69,959,846 azioni. I maggiori azionisti includono Bizma Investimentos Ltda, Polunin Capital Partners Ltd, BlackRock, Inc., Morgan Stanley, American Century Companies Inc, Renaissance Technologies Llc, AVEM - Avantis Emerging Markets Equity ETF, IGF - iShares Global Infrastructure ETF, Jpmorgan Chase & Co, and HFCGX - Hennessy Cornerstone Growth Fund Investor Class .
(Ultrapar Participações S.A. - Depositary Receipt (Common Stock) (BMV:UGP N) la struttura proprietaria istituzionale mostra le attuali posizioni nella società da parte di istituzioni e fondi, nonché le ultime variazioni nella dimensione della posizione. I principali azionisti possono essere singoli investitori, fondi comuni, hedge fund o istituzioni. L'allegato 13D indica che l'investitore detiene (o ha detenuto) più del 5% della società e intende (o intendeva) perseguire attivamente un cambiamento nella strategia aziendale. L'allegato 13G indica un investimento passivo superiore al 5%.
Indice del sentiment dei fondi
L'indice del sentiment dei fondi (anche noto come "indice di accumulo di proprietà") individua i titoli più acquistati dai fondi. È il risultato di un sofisticato modello quantitativo multi-fattore che identifica le società con i più alti livelli di accumulo istituzionale. Il modello utilizza una combinazione dell'aumento totale dei proprietari dichiarati, delle variazioni nelle allocazioni di portafoglio di tali proprietari e di altre metriche. Il punteggio varia da 0 a 100: i numeri più alti indicano un livello di accumulo superiore ad altre società, mentre 50 rappresenta la media.
Frequenza di aggiornamento: giornaliera
Consulta Ownership Explorer per visualizzare l'elenco delle aziende con il ranking più alto.
Depositi 13F e NPORT
Le informazioni relative ai depositi 13F sono gratuite. Per accedere alle informazioni relative ai depositi NP è necessario un'abbonamento premium. Le righe verdi indicano le nuove posizioni. Le righe rosse indicano le posizioni chiuse. Fai clic sull'icona del link per visualizzare la cronologia completa delle transazioni.
Esegui l'upgrade
per sbloccare i dati premium ed esportarli in Excel ![]() .
.
| Data di deposito | Fonte | Investitore | Tipo | Prezzo medio (Stima) |
Azioni | Δ Azioni (%) |
Valore dichiarato ($ 1000) |
Δ Valore (%) |
Allocazione del portafoglio (%) |
|
|---|---|---|---|---|---|---|---|---|---|---|
| 2025-08-14 | 13F | Wellington Management Group Llp | 582.781 | -1,16 | 1.912 | 5,23 | ||||
| 2025-08-12 | 13F | O'shaughnessy Asset Management, Llc | 295.590 | -7,33 | 970 | -1,32 | ||||
| 2025-07-21 | 13F | Mirae Asset Global Investments Co., Ltd. | 39.333 | 7,46 | 129 | 14,16 | ||||
| 2025-07-24 | 13F | Ronald Blue Trust, Inc. | 16.425 | 27,61 | 54 | 35,90 | ||||
| 2025-06-26 | NP | OWSMX - Old Westbury Small & Mid Cap Strategies Fund | 1.729.047 | 5.446 | ||||||
| 2025-08-11 | 13F | Frank, Rimerman Advisors LLC | 55.105 | 181 | ||||||
| 2025-08-13 | 13F | Hsbc Holdings Plc | 367.357 | 18,81 | 1.203 | 26,50 | ||||
| 2025-08-26 | NP | EMIF - iShares Emerging Markets Infrastructure ETF | 71.595 | -28,19 | 235 | -23,78 | ||||
| 2025-06-26 | NP | DFA INVESTMENT DIMENSIONS GROUP INC - Emerging Markets Sustainability Core 1 Portfolio Institutional Class This fund is a listed as child fund of Dimensional Fund Advisors Lp and if that institution has disclosed ownership in this security, then these positions will not be double counted when calculating total shares and total value | 55.886 | 0,00 | 176 | 11,39 | ||||
| 2025-06-23 | NP | UBPIX - Ultralatin America Profund Investor Class | 14.392 | -6,18 | 45 | 4,65 | ||||
| 2025-07-15 | 13F | Regatta Capital Group, Llc | 12.475 | 41 | ||||||
| 2025-08-14 | 13F | Boston Private Wealth Llc | 0 | -100,00 | 0 | |||||
| 2025-07-11 | 13F | Farther Finance Advisors, LLC | 5.677 | 4,57 | 19 | 12,50 | ||||
| 2025-08-28 | NP | QEMM - SPDR MSCI Emerging Markets StrategicFactors ETF | 2.489 | -3,86 | 8 | 14,29 | ||||
| 2025-05-05 | 13F | Transce3nd, LLC | 0 | -100,00 | 0 | |||||
| 2025-08-14 | 13F/A | Skopos Labs, Inc. | 43 | 0 | ||||||
| 2025-08-14 | 13F | State Street Corp | 860.043 | 0,48 | 2.821 | 6,98 | ||||
| 2025-08-07 | 13F | Connor, Clark & Lunn Investment Management Ltd. | 23.566 | -17,97 | 77 | -12,50 | ||||
| 2025-08-14 | 13F | TCG Advisory Services, LLC | 14.110 | -39,61 | 46 | -35,21 | ||||
| 2025-06-26 | NP | DEXC - Dimensional Emerging Markets ex China Core Equity ETF | 25.200 | 20,57 | 79 | 33,90 | ||||
| 2025-08-12 | 13F | Aigen Investment Management, Lp | 20.043 | 16,81 | 66 | 25,00 | ||||
| 2025-08-08 | 13F | Financial Gravity Companies, Inc. | 41 | -50,00 | 0 | |||||
| 2025-07-16 | 13F | Signaturefd, Llc | 28.719 | 53,61 | 94 | 64,91 | ||||
| 2025-08-14 | 13F | RBF Capital, LLC | 98.800 | 0,00 | 324 | 6,58 | ||||
| 2025-08-13 | 13F | West Family Investments, Inc. | 33.240 | 5,67 | 109 | 13,54 | ||||
| 2025-08-14 | 13F | Qube Research & Technologies Ltd | 1.513.765 | -6,23 | 4.965 | -0,14 | ||||
| 2025-08-13 | 13F | Russell Investments Group, Ltd. | 69.292 | -36,62 | 227 | -32,44 | ||||
| 2025-08-14 | 13F | Wetherby Asset Management Inc | 48.577 | 85,16 | 159 | 133,82 | ||||
| 2025-08-12 | 13F | Wayfinding Financial, LLC | 0 | -100,00 | 0 | |||||
| 2025-08-14 | 13F | Smartleaf Asset Management LLC | 2.608 | 8 | ||||||
| 2025-08-14 | 13F | Bank Of America Corp /de/ | 495.345 | -53,95 | 1.625 | -50,98 | ||||
| 2025-08-26 | NP | IGF - iShares Global Infrastructure ETF | 1.979.877 | -2,76 | 6.494 | 3,54 | ||||
| 2025-07-31 | 13F | R Squared Ltd | 16.500 | 54 | ||||||
| 2025-08-14 | 13F | Point72 Asset Management, L.P. | 595.033 | 12,08 | 1.952 | 19,33 | ||||
| 2025-07-22 | 13F | Simplicity Wealth,LLC | 0 | -100,00 | 0 | |||||
| 2025-08-14 | 13F | Royal Bank Of Canada | 1.182 | 3.376,47 | 4 | |||||
| 2025-06-26 | NP | DFAX - Dimensional World ex U.S. Core Equity 2 ETF | 87.144 | 50,13 | 275 | 67,07 | ||||
| 2025-08-13 | 13F | Northwestern Mutual Wealth Management Co | 1.517 | 5 | ||||||
| 2025-08-14 | 13F | Schonfeld Strategic Advisors LLC | 15.922 | -78,86 | 52 | -77,49 | ||||
| 2025-07-24 | 13F | Us Bancorp \de\ | 20.401 | -19,94 | 67 | -15,38 | ||||
| 2025-08-08 | 13F | Mitsubishi UFJ Trust & Banking Corp | 14.622 | 0,00 | 48 | 4,44 | ||||
| 2025-08-06 | 13F | First Horizon Advisors, Inc. | 213 | -93,17 | 1 | -100,00 | ||||
| 2025-04-30 | 13F | Sofos Investments, Inc. | 82 | 0 | ||||||
| 2025-08-12 | 13F | Pathstone Holdings, LLC | 32.844 | 2,15 | 108 | 8,08 | ||||
| 2025-08-12 | 13F | American Century Companies Inc | 2.695.322 | 42,44 | 8.841 | 51,68 | ||||
| 2025-08-13 | 13F | Wealthquest Corp | 0 | -100,00 | 0 | -100,00 | ||||
| 2025-08-07 | 13F | Sierra Ocean, Llc | 902 | 56,60 | 3 | 100,00 | ||||
| 2025-08-15 | 13F | CI Private Wealth, LLC | 61.535 | 0,31 | 202 | 6,91 | ||||
| 2025-08-13 | 13F | EverSource Wealth Advisors, LLC | 6.586 | 37,61 | 22 | 50,00 | ||||
| 2025-08-12 | 13F | Longfellow Investment Management Co Llc | 616.345 | 39,59 | 2.022 | 48,71 | ||||
| 2025-08-14 | 13F | Atomi Financial Group, Inc. | 18.946 | -8,99 | 62 | -3,12 | ||||
| 2025-08-11 | 13F | EntryPoint Capital, LLC | 29.607 | -3,71 | 97 | 3,19 | ||||
| 2025-08-15 | 13F | Tower Research Capital LLC (TRC) | 0 | -100,00 | 0 | |||||
| 2025-05-05 | 13F | Lindbrook Capital, Llc | 6.635 | 83,69 | 20 | 122,22 | ||||
| 2025-05-14 | 13F | Group One Trading, L.p. | Call | 0 | -100,00 | 0 | -100,00 | |||
| 2025-07-14 | 13F | GAMMA Investing LLC | 18.220 | 4,63 | 60 | 11,32 | ||||
| 2025-07-15 | 13F | Ballentine Partners, LLC | 13.051 | -11,49 | 43 | -6,67 | ||||
| 2025-08-07 | 13F | Acadian Asset Management Llc | 1.139.033 | -17,90 | 4 | -25,00 | ||||
| 2025-07-29 | NP | RBB FUND, INC. - Aquarius International Fund | 8.959 | 0,00 | 26 | 0,00 | ||||
| 2025-08-13 | 13F | Renaissance Technologies Llc | 2.414.700 | 12,22 | 7.920 | 19,51 | ||||
| 2025-08-13 | 13F | Quadrant Capital Group Llc | 497.253 | 1.248,85 | 1.631 | 1.342,48 | ||||
| 2025-08-14 | 13F | Bizma Investimentos Ltda | 14.079.999 | 0,00 | 46.182 | 6,49 | ||||
| 2025-06-18 | NP | RTXAX - Tax-Managed Real Assets Fund Class A | 69.292 | -36,62 | 218 | -29,68 | ||||
| 2025-08-28 | NP | GII - SPDR(R) S&P GLOBAL INFRASTRUCTURE ETF | 147.200 | -12,07 | 483 | -6,41 | ||||
| 2025-08-14 | 13F | VPR Management LLC | 46.700 | 0,00 | 153 | 6,99 | ||||
| 2025-05-14 | 13F | Barometer Capital Management Inc. | 0 | -100,00 | 0 | |||||
| 2025-07-25 | 13F | JustInvest LLC | 77.467 | 115,55 | 254 | 130,91 | ||||
| 2025-05-16 | 13F | Dynamic Technology Lab Private Ltd | 0 | -100,00 | 0 | -100,00 | ||||
| 2025-08-13 | 13F | Marshall Wace, Llp | 915.813 | -65,06 | 3.004 | -62,80 | ||||
| 2025-08-14 | 13F | Group One Trading, L.p. | 0 | -100,00 | 0 | |||||
| 2025-08-13 | 13F | Arrowstreet Capital, Limited Partnership | 0 | -100,00 | 0 | |||||
| 2025-08-29 | NP | Cantor Fitzgerald Sustainable Infrastructure Fund | 89.500 | 0,00 | 294 | 6,55 | ||||
| 2025-05-14 | 13F | Walleye Capital LLC | 0 | -100,00 | 0 | |||||
| 2025-08-14 | 13F | Fmr Llc | 33.708 | -78,09 | 111 | -76,74 | ||||
| 2025-08-14 | 13F | Citadel Advisors Llc | 0 | -100,00 | 0 | -100,00 | ||||
| 2025-08-14 | 13F | Citadel Advisors Llc | Call | 0 | -100,00 | 0 | -100,00 | |||
| 2025-07-24 | 13F | IFP Advisors, Inc | 330 | 0,00 | 1 | 0,00 | ||||
| 2025-08-08 | 13F | Creative Planning | 250.101 | 44,20 | 820 | 53,56 | ||||
| 2025-06-26 | NP | DFEV - Dimensional Emerging Markets Value ETF | 59.695 | -17,32 | 188 | -8,29 | ||||
| 2025-06-26 | NP | DFSE - Dimensional Emerging Markets Sustainability Core 1 ETF | 50.602 | 1.388,29 | 159 | 1.666,67 | ||||
| 2025-04-25 | NP | VCGEX - Emerging Economies Fund | 136.372 | 42,61 | 390 | 38,30 | ||||
| 2025-08-01 | 13F | Envestnet Asset Management Inc | 34.083 | -3,63 | 112 | 2,78 | ||||
| 2025-08-06 | 13F | Metis Global Partners, LLC | 47.378 | 5,62 | 155 | 12,32 | ||||
| 2025-08-14 | 13F | Cubist Systematic Strategies, LLC | 333.307 | -1,19 | 1.093 | 5,30 | ||||
| 2025-08-15 | 13F | Morgan Stanley | 6.332.966 | 40,50 | 20.772 | 49,63 | ||||
| 2025-07-30 | NP | APIE - ActivePassive International Equity ETF | 17.375 | -58,01 | 50 | -59,84 | ||||
| 2025-08-14 | 13F | Ieq Capital, Llc | 24.085 | 53,84 | 79 | 62,50 | ||||
| 2025-05-13 | 13F | Quantbot Technologies LP | 0 | -100,00 | 0 | |||||
| 2025-06-26 | NP | DFEM - Dimensional Emerging Markets Core Equity 2 ETF | 42.882 | 119,91 | 135 | 145,45 | ||||
| 2025-05-16 | 13F | Jones Financial Companies Lllp | 0 | -100,00 | 0 | |||||
| 2025-08-13 | 13F | Quadrature Capital Ltd | 13.660 | 45 | ||||||
| 2025-08-07 | 13F | Profund Advisors Llc | 15.320 | -14,60 | 50 | -9,09 | ||||
| 2025-08-12 | 13F | Jpmorgan Chase & Co | 1.878.904 | 75,20 | 6.163 | 86,56 | ||||
| 2025-08-13 | 13F | Northern Trust Corp | 150.319 | 1,32 | 493 | 8,11 | ||||
| 2025-08-08 | 13F | SG Americas Securities, LLC | 285.874 | 119,43 | 1 | |||||
| 2025-07-14 | 13F | Abound Wealth Management | 64 | 0,00 | 0 | |||||
| 2025-08-14 | 13F | Two Sigma Advisers, Lp | 763.100 | -37,55 | 2.503 | -33,51 | ||||
| 2025-08-14 | 13F | Engineers Gate Manager LP | 27.085 | -49,91 | 89 | -46,99 | ||||
| 2025-08-12 | 13F | Dimensional Fund Advisors Lp | 519.028 | 46,75 | 1.702 | 56,29 | ||||
| 2025-07-18 | 13F | Trust Co Of Vermont | 4.339 | 14 | ||||||
| 2025-07-29 | 13F | Wealthstream Advisors, Inc. | 14.041 | 46 | ||||||
| 2025-08-08 | 13F | Pnc Financial Services Group, Inc. | 71.263 | 33,57 | 234 | 42,07 | ||||
| 2025-05-08 | 13F | XTX Topco Ltd | 0 | -100,00 | 0 | |||||
| 2025-07-28 | NP | AVEEX - Avantis Emerging Markets Equity Fund Institutional Class This fund is a listed as child fund of American Century Companies Inc and if that institution has disclosed ownership in this security, then these positions will not be double counted when calculating total shares and total value | 58.586 | 0,00 | 167 | -0,60 | ||||
| 2025-08-14 | 13F | Aqr Capital Management Llc | 52.803 | -25,46 | 173 | -20,64 | ||||
| 2025-08-15 | 13F | WealthCollab, LLC | 1.097 | 4 | ||||||
| 2025-07-21 | 13F | Hennessy Advisors Inc | 0 | -100,00 | 0 | |||||
| 2025-07-30 | 13F | Bleakley Financial Group, LLC | 167.528 | 9,81 | 549 | 17,06 | ||||
| 2025-08-05 | 13F | Simplex Trading, Llc | 421 | 0 | ||||||
| 2025-08-14 | 13F | Jane Street Group, Llc | 155.483 | 510 | ||||||
| 2025-05-15 | 13F | Wolverine Trading, Llc | 0 | -100,00 | 0 | |||||
| 2025-08-12 | 13F | Virtu Financial LLC | 52.420 | 0 | ||||||
| 2025-05-15 | 13F | Jain Global LLC | 0 | -100,00 | 0 | |||||
| 2025-03-28 | NP | HFCGX - Hennessy Cornerstone Growth Fund Investor Class | 1.840.000 | 7,17 | 5.226 | -15,93 | ||||
| 2025-08-14 | 13F | Mercer Global Advisors Inc /adv | 0 | -100,00 | 0 | |||||
| 2025-07-25 | 13F | Sequoia Financial Advisors, LLC | 59.097 | 12,79 | 194 | 19,88 | ||||
| 2025-08-14 | 13F | Manufacturers Life Insurance Company, The | 17.044 | 56 | ||||||
| 2025-07-24 | 13F | Jfs Wealth Advisors, Llc | 253 | 0,00 | 1 | |||||
| 2025-08-14 | 13F | Goldman Sachs Group Inc | 1.388.506 | -31,74 | 4.554 | -27,30 | ||||
| 2025-08-11 | 13F | Inspire Advisors, LLC | 40.603 | -17,67 | 133 | -11,92 | ||||
| 2025-08-12 | 13F | Deutsche Bank Ag\ | 6.430 | 23,11 | 21 | 31,25 | ||||
| 2025-07-28 | NP | AVEM - Avantis Emerging Markets Equity ETF This fund is a listed as child fund of American Century Companies Inc and if that institution has disclosed ownership in this security, then these positions will not be double counted when calculating total shares and total value | 2.136.119 | 21,31 | 6.088 | 20,89 | ||||
| 2025-08-12 | 13F | Franklin Resources Inc | 22.832 | 100,79 | 75 | 111,43 | ||||
| 2025-07-24 | 13F | PDS Planning, Inc | 32.111 | 22,99 | 105 | 31,25 | ||||
| 2025-08-14 | 13F | Hrt Financial Lp | 0 | -100,00 | 0 | |||||
| 2025-03-26 | NP | BLACKROCK FUNDS - BlackRock Advantage ESG Emerging Markets Equity Fund Institutional This fund is a listed as child fund of BlackRock, Inc. and if that institution has disclosed ownership in this security, then these positions will not be double counted when calculating total shares and total value | 14.630 | 104,99 | 42 | 64,00 | ||||
| 2025-07-31 | 13F | Caitong International Asset Management Co., Ltd | 2.577 | 1.573,38 | 8 | |||||
| 2025-08-14 | 13F | Ubs Asset Management Americas Inc | 460.000 | 15,00 | 1.509 | 22,40 | ||||
| 2025-07-24 | 13F | CWM Advisors, LLC | 18.501 | 6,55 | 61 | 13,21 | ||||
| 2025-08-14 | 13F | Vident Advisory, LLC | 268.982 | 93,64 | 882 | 106,56 | ||||
| 2025-08-18 | 13F | Geneos Wealth Management Inc. | 195 | 1 | ||||||
| 2025-08-12 | 13F | BlackRock, Inc. | 7.328.461 | 12,93 | 24.037 | 20,27 | ||||
| 2025-07-16 | 13F | Beaumont Financial Advisors, LLC | 22.743 | 0,00 | 75 | 5,71 | ||||
| 2025-08-14 | 13F | Millennium Management Llc | 688.119 | -23,93 | 2.257 | -18,99 | ||||
| 2025-08-14 | 13F | Aprio Wealth Management, LLC | 35.365 | -58,57 | 116 | -56,11 | ||||
| 2025-07-25 | 13F | Yousif Capital Management, Llc | 17.210 | 0,00 | 56 | 5,66 | ||||
| 2025-07-25 | 13F | Cwm, Llc | 10.617 | 12,19 | 0 | |||||
| 2025-07-28 | NP | AVES - Avantis Emerging Markets Value ETF This fund is a listed as child fund of American Century Companies Inc and if that institution has disclosed ownership in this security, then these positions will not be double counted when calculating total shares and total value | 113.541 | 2.082,64 | 324 | 2.207,14 | ||||
| 2025-04-21 | 13F | Nelson, Van Denburg & Campbell Wealth Management Group, LLC | 0 | -100,00 | 0 | |||||
| 2025-09-04 | 13F/A | Advisor Group Holdings, Inc. | 3.035 | 1,17 | 10 | 0,00 | ||||
| 2025-06-26 | NP | DFCEX - Emerging Markets Core Equity Portfolio - Institutional Class This fund is a listed as child fund of Dimensional Fund Advisors Lp and if that institution has disclosed ownership in this security, then these positions will not be double counted when calculating total shares and total value | 12.552 | 0,00 | 40 | 11,43 | ||||
| 2025-08-14 | 13F | Wells Fargo & Company/mn | 5.920 | 0,00 | 19 | 5,56 | ||||
| 2025-07-28 | NP | NSI - National Security Emerging Markets Index ETF | 4.966 | 38,48 | 14 | 40,00 | ||||
| 2025-08-05 | 13F | Simplex Trading, Llc | Call | 0 | -100,00 | 0 | ||||
| 2025-05-15 | 13F/A | Orion Portfolio Solutions, LLC | 17.996 | -5,33 | 55 | 12,24 | ||||
| 2025-08-11 | 13F | Citigroup Inc | 60.712 | 4,60 | 199 | 11,80 | ||||
| 2025-08-08 | 13F | Principal Financial Group Inc | 88.709 | 291 | ||||||
| 2025-07-28 | NP | AVXC - Avantis Emerging Markets ex-China Equity ETF | 33.389 | 352,18 | 95 | 352,38 | ||||
| 2025-07-29 | 13F | Private Trust Co Na | 97 | 0,00 | 0 | |||||
| 2025-07-21 | 13F | Qrg Capital Management, Inc. | 12.666 | -7,27 | 42 | -2,38 | ||||
| 2025-08-14 | 13F | Citadel Advisors Llc | Put | 10.200 | 96,15 | 33 | 106,25 | |||
| 2025-07-10 | 13F | Polunin Capital Partners Ltd | 9.457.242 | 8,95 | 31 | 34,78 | ||||
| 2025-08-06 | 13F | True Wealth Design, LLC | 20 | 0,00 | 0 | |||||
| 2025-07-28 | 13F | Ritholtz Wealth Management | 156.042 | 56,65 | 512 | 66,99 | ||||
| 2025-08-12 | 13F | Proequities, Inc. | Put | 0 | 0 | |||||
| 2025-06-26 | NP | DFAE - Dimensional Emerging Core Equity Market ETF | 52.584 | -55,13 | 166 | -50,30 | ||||
| 2025-08-12 | 13F | Proequities, Inc. | Call | 0 | 0 | |||||
| 2025-08-12 | 13F | Proequities, Inc. | 0 | 0 | ||||||
| 2025-08-14 | 13F | UBS Group AG | 1.246.471 | 113,62 | 4.088 | 127,49 | ||||
| 2025-08-12 | 13F | Rhumbline Advisers | 179.412 | 0,78 | 588 | 7,30 | ||||
| 2025-08-18 | 13F/A | National Bank Of Canada /fi/ | 1.150 | 4 | ||||||
| 2025-07-09 | 13F | Sivia Capital Partners, LLC | 21.728 | 1,79 | 71 | 9,23 | ||||
| 2025-08-07 | 13F | Allworth Financial LP | 637 | 7,24 | 2 | 100,00 | ||||
| 2025-08-14 | 13F | Susquehanna International Group, Llp | 53.504 | -51,89 | 175 | -48,83 | ||||
| 2025-08-14 | 13F | Sei Investments Co | 66.997 | 26,56 | 220 | 34,36 | ||||
| 2025-08-14 | 13F/A | Barclays Plc | 104.379 | 34,11 | 0 | |||||
| 2025-08-11 | 13F | Raiffeisen Bank International AG | 411.999 | 54,13 | 1.273 | 53,19 | ||||
| 2025-08-12 | 13F | MAI Capital Management | 4.762 | 16 | ||||||
| 2025-07-15 | 13F | Public Employees Retirement System Of Ohio | 3.903 | 0,00 | 13 | 0,00 | ||||
| 2025-08-12 | 13F | Advisors Asset Management, Inc. | 136.629 | -5,04 | 448 | 1,13 | ||||
| 2025-08-13 | 13F | Invesco Ltd. | 177.847 | 80,88 | 583 | 93,05 | ||||
| 2025-08-12 | 13F | Legal & General Group Plc | 135.500 | 0,00 | 445 | 6,46 | ||||
| 2025-08-12 | 13F | Global Retirement Partners, LLC | 1.209 | 0,00 | 4 | 0,00 | ||||
| 2025-08-14 | 13F | Mariner, LLC | 136.325 | 56,53 | 446 | 66,42 | ||||
| 2025-07-30 | 13F | Ethic Inc. | 32.797 | 42,71 | 102 | 42,25 | ||||
| 2025-07-08 | 13F | Parallel Advisors, LLC | 21.295 | -0,91 | 70 | 4,55 | ||||
| 2025-08-14 | 13F | Axa S.a. | 12.831 | 0,00 | 42 | 7,69 | ||||
| 2025-04-23 | 13F | Pinnacle Bancorp, Inc. | 0 | -100,00 | 0 | |||||
| 2025-08-12 | 13F | Coldstream Capital Management Inc | 0 | -100,00 | 0 | |||||
| 2025-08-13 | 13F | Cerity Partners LLC | 76.297 | -0,59 | 250 | 5,93 | ||||
| 2025-08-13 | 13F | Mackenzie Financial Corp | 45.926 | 151 | ||||||
| 2025-08-14 | 13F | Bnp Paribas Arbitrage, Sa | 374.838 | 434,87 | 1.229 | 471,63 | ||||
| 2025-08-27 | 13F/A | Brinker Capital Investments, LLC | 17.147 | -4,72 | 56 | 1,82 | ||||
| 2025-08-14 | 13F | Two Sigma Investments, Lp | 1.013.235 | -24,48 | 3.323 | -19,58 |