Statistiche di base
| Proprietari istituzionali | 96 total, 84 long only, 0 short only, 12 long/short - change of 75,00% MRQ |
| Allocazione media del portafoglio | 0.0003 % - change of 4.767,23% MRQ |
| Azioni istituzionali (Long) | 18.687.257 (ex 13D/G) - change of 0,02MM shares 212,80% MRQ |
| Valore istituzionale (Long) | $ 317.293 USD ($1000) |
Proprietà istituzionale e azionisti
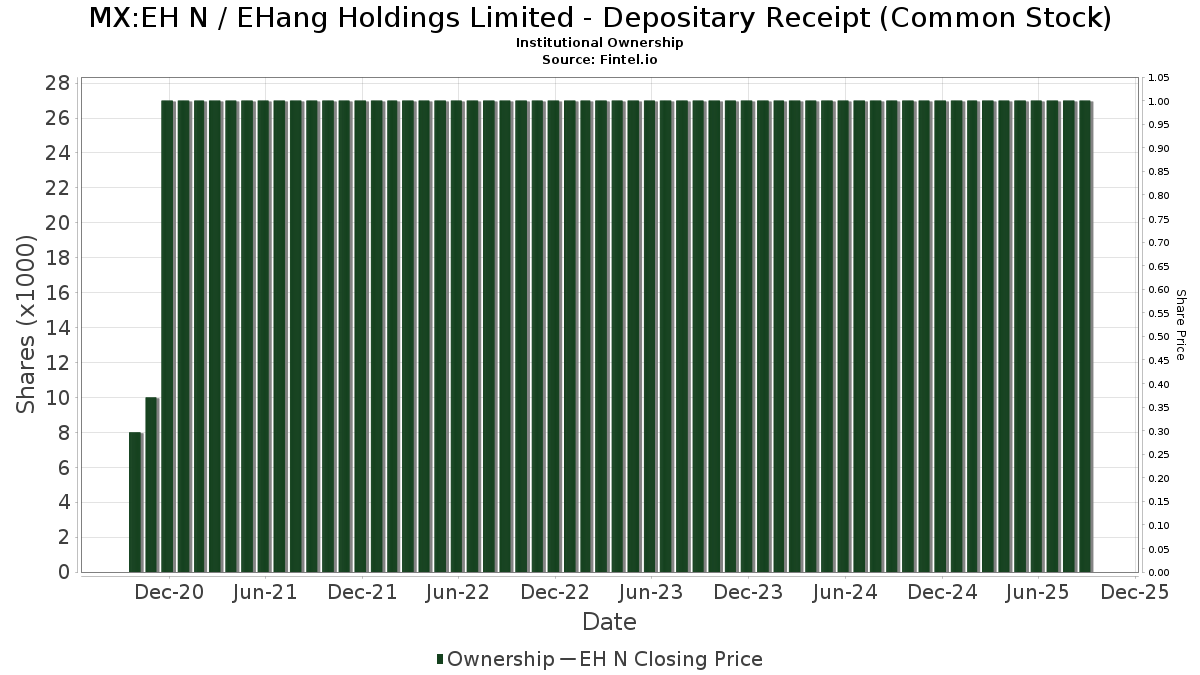
EHang Holdings Limited - Depositary Receipt (Common Stock) (MX:EH N) ha 96 proprietari istituzionali e azionisti che hanno presentato i moduli 13D/G o 13F alla Securities Exchange Commission (SEC). Queste istituzioni detengono un totale di 18,687,257 azioni. I maggiori azionisti includono Axim Planning & Wealth, Jane Street Group, Llc, Vanguard Group Inc, Susquehanna International Group, Llp, Susquehanna International Group, Llp, Susquehanna International Group, Llp, FIL Ltd, Peak6 Llc, KADENSA CAPITAL Ltd, and State Street Corp .
(EHang Holdings Limited - Depositary Receipt (Common Stock) (BMV:EH N) la struttura proprietaria istituzionale mostra le attuali posizioni nella società da parte di istituzioni e fondi, nonché le ultime variazioni nella dimensione della posizione. I principali azionisti possono essere singoli investitori, fondi comuni, hedge fund o istituzioni. L'allegato 13D indica che l'investitore detiene (o ha detenuto) più del 5% della società e intende (o intendeva) perseguire attivamente un cambiamento nella strategia aziendale. L'allegato 13G indica un investimento passivo superiore al 5%.
Indice del sentiment dei fondi
L'indice del sentiment dei fondi (anche noto come "indice di accumulo di proprietà") individua i titoli più acquistati dai fondi. È il risultato di un sofisticato modello quantitativo multi-fattore che identifica le società con i più alti livelli di accumulo istituzionale. Il modello utilizza una combinazione dell'aumento totale dei proprietari dichiarati, delle variazioni nelle allocazioni di portafoglio di tali proprietari e di altre metriche. Il punteggio varia da 0 a 100: i numeri più alti indicano un livello di accumulo superiore ad altre società, mentre 50 rappresenta la media.
Frequenza di aggiornamento: giornaliera
Consulta Ownership Explorer per visualizzare l'elenco delle aziende con il ranking più alto.
AI+ Ask Fintel’s AI assistant about EHang Holdings Limited - Depositary Receipt (Common Stock).
Select a question to share a public post with an AI-crafted answer.
Thinking of good questions…
Depositi 13F e NPORT
Le informazioni relative ai depositi 13F sono gratuite. Per accedere alle informazioni relative ai depositi NP è necessario un'abbonamento premium. Le righe verdi indicano le nuove posizioni. Le righe rosse indicano le posizioni chiuse. Fai clic sull'icona del link per visualizzare la cronologia completa delle transazioni.
Esegui l'upgrade
per sbloccare i dati premium ed esportarli in Excel ![]() .
.
| Data di deposito | Fonte | Investitore | Tipo | Prezzo medio (Stima) |
Azioni | Δ Azioni (%) |
Valore dichiarato ($ 1000) |
Δ Valore (%) |
Allocazione del portafoglio (%) |
|
|---|---|---|---|---|---|---|---|---|---|---|
| 2025-11-10 | 13F | Citigroup Inc | 10.019 | -16,57 | 186 | -10,58 | ||||
| 2025-11-14 | 13F | Hrt Financial Lp | 0 | -100,00 | 0 | |||||
| 2026-02-06 | 13F | IFP Advisors, Inc | 894 | 0,00 | 12 | -31,25 | ||||
| 2025-08-12 | 13F | Trexquant Investment LP | 0 | -100,00 | 0 | |||||
| 2026-02-03 | 13F | SBI Securities Co., Ltd. | 24.241 | -5,12 | 319 | -32,70 | ||||
| 2025-08-14 | 13F | Schonfeld Strategic Advisors LLC | 0 | -100,00 | 0 | |||||
| 2026-01-27 | 13F | TD Waterhouse Canada Inc. | 82 | 1 | ||||||
| 2025-11-13 | 13F | FIL Ltd | 1.362.836 | 25.308 | ||||||
| 2025-11-04 | 13F | Jones Financial Companies Lllp | 5.613 | 9,99 | 101 | 17,44 | ||||
| 2025-08-14 | 13F | Tudor Investment Corp Et Al | 0 | -100,00 | 0 | -100,00 | ||||
| 2025-11-14 | 13F | Tiger Pacific Capital LP | 481.841 | 8.948 | ||||||
| 2026-01-29 | 13F | Vanguard Group Inc | 2.040.225 | 0,87 | 26.890 | -28,41 | ||||
| 2025-09-26 | NP | UGPIX - UltraChina ProFund Investor Class | 3.114 | 64,67 | 54 | 74,19 | ||||
| 2025-11-14 | 13F | Lighthouse Investment Partners, LLC | 0 | -100,00 | 0 | -100,00 | ||||
| 2025-11-14 | 13F | Mml Investors Services, Llc | 12.554 | 4,67 | 233 | |||||
| 2026-02-06 | 13F | FourThought Financial Partners, LLC | 14.429 | 190 | ||||||
| 2025-11-14 | 13F | Susquehanna International Group, Llp | Call | 1.712.900 | 20,59 | 31.809 | 29,00 | |||
| 2025-09-25 | NP | VGTSX - Vanguard Total International Stock Index Fund Investor Shares | 709.434 | 20,20 | 12.415 | 25,59 | ||||
| 2025-11-14 | 13F | Susquehanna International Group, Llp | Put | 1.936.000 | 74,02 | 35.952 | 86,15 | |||
| 2025-11-14 | 13F | Susquehanna International Group, Llp | 1.773.477 | 32.933 | ||||||
| 2026-02-10 | 13F | Exit Wealth Advisors, LLC. | 0 | -100,00 | 0 | |||||
| 2025-11-12 | 13F | BlackRock, Inc. | 23.697 | -81,02 | 440 | -79,70 | ||||
| 2025-08-28 | NP | SPEM - SPDR(R) Portfolio Emerging Markets ETF | 40.170 | 1,94 | 697 | -15,31 | ||||
| 2025-11-14 | 13F | Citadel Advisors Llc | Call | 792.900 | 69,57 | 14.724 | 81,40 | |||
| 2025-10-15 | 13F | Cwm, Llc | 0 | -100,00 | 0 | |||||
| 2025-11-14 | 13F | Citadel Advisors Llc | 356.703 | 128,86 | 6.624 | 144,84 | ||||
| 2025-11-14 | 13F | Citadel Advisors Llc | Put | 639.200 | 64,87 | 11.870 | 76,36 | |||
| 2025-11-14 | 13F | Man Group plc | 0 | -100,00 | 0 | |||||
| 2025-09-23 | NP | SEKAX - DWS Emerging Markets Equity Fund Class A | 3.500 | 61 | ||||||
| 2026-02-06 | 13F | Leonteq Securities AG | 2.000 | 26 | ||||||
| 2025-11-14 | 13F | Nomura Holdings Inc | 39.978 | 742 | ||||||
| 2025-08-14 | 13F | Voloridge Investment Management, Llc | 0 | -100,00 | 0 | |||||
| 2025-09-25 | NP | VEIEX - Vanguard Emerging Markets Stock Index Fund Investor Shares | 633.483 | 17,36 | 11.086 | 22,61 | ||||
| 2025-08-14 | 13F | Verition Fund Management LLC | 0 | -100,00 | 0 | |||||
| 2026-02-04 | 13F | Tsfg, Llc | 40 | 0,00 | 0 | |||||
| 2025-11-13 | 13F | Hsbc Holdings Plc | 26.799 | 56,97 | 499 | 66,33 | ||||
| 2025-11-14 | 13F | Cubist Systematic Strategies, LLC | Call | 19.800 | 368 | |||||
| 2025-08-28 | NP | EWX - SPDR(R) S&P(R) EMERGING MARKETS SMALL CAP ETF | 31.865 | 0,00 | 553 | -16,84 | ||||
| 2026-02-06 | 13F | Larson Financial Group LLC | 838 | 7,02 | 11 | -21,43 | ||||
| 2025-11-03 | 13F | Federated Hermes, Inc. | 84.613 | 1.571 | ||||||
| 2025-11-14 | 13F | Cubist Systematic Strategies, LLC | Put | 18.800 | 349 | |||||
| 2025-11-14 | 13F | Toronto Dominion Bank | 0 | -100,00 | 0 | |||||
| 2026-01-27 | 13F | WealthCollab, LLC | 20 | 0,00 | 0 | |||||
| 2025-11-06 | 13F | Ameritas Advisory Services, LLC | 0 | -100,00 | 0 | |||||
| 2025-11-14 | 13F | Virtu Financial LLC | 0 | -100,00 | 0 | |||||
| 2025-08-13 | 13F | Centiva Capital, LP | 0 | -100,00 | 0 | |||||
| 2026-01-21 | 13F | Sound Income Strategies, LLC | 45 | 0,00 | 1 | |||||
| 2025-11-14 | 13F | Millennium Management Llc | 0 | -100,00 | 0 | -100,00 | ||||
| 2025-11-12 | 13F | Headlands Technologies LLC | 65.560 | -18,22 | 1.217 | -12,51 | ||||
| 2025-11-14 | 13F | Skopos Labs, Inc. | 0 | -100,00 | 0 | -100,00 | ||||
| 2025-10-31 | 13F | Y-Intercept (Hong Kong) Ltd | 0 | -100,00 | 0 | |||||
| 2025-11-14 | 13F | Point72 Europe (London) LLP | 33.600 | 624 | ||||||
| 2025-11-06 | 13F | Rhumbline Advisers | 1.303 | -20,69 | 24 | -14,29 | ||||
| 2025-08-22 | NP | FDRV - Fidelity Electric Vehicles and Future Transportation ETF | 0 | -100,00 | 0 | -100,00 | ||||
| 2025-11-19 | 13F | Caitong International Asset Management Co., Ltd | 0 | -100,00 | 0 | -100,00 | ||||
| 2025-11-10 | 13F | Eleva Capital SAS | 0 | -100,00 | 0 | |||||
| 2025-11-13 | 13F | Carmignac Gestion | 62.673 | -41,14 | 1.164 | -37,07 | ||||
| 2026-01-29 | 13F | UBS Group AG | 941.689 | 19,03 | 12.411 | -15,52 | ||||
| 2025-11-12 | 13F | Group One Trading, L.p. | 692.434 | 398,17 | 12.858 | 433,08 | ||||
| 2026-02-09 | 13F | Legal & General Group Plc | 3.380 | 0,00 | 45 | -29,03 | ||||
| 2026-02-09 | 13F | Harbour Investments, Inc. | 10 | 0 | ||||||
| 2026-02-05 | 13F | Baader Bank INC | 20.000 | -20,00 | 264 | -43,32 | ||||
| 2026-02-09 | 13F | Geode Capital Management, Llc | 33.547 | 0,00 | 442 | -28,94 | ||||
| 2025-11-14 | 13F | Royal Bank Of Canada | 5.794 | -72,38 | 108 | -70,33 | ||||
| 2026-02-03 | 13F/A | Bank Of America Corp /de/ | 100.717 | 32,21 | 1.870 | 41,45 | ||||
| 2025-09-26 | NP | PGJ - Invesco Golden Dragon China ETF This fund is a listed as child fund of Invesco Ltd. and if that institution has disclosed ownership in this security, then these positions will not be double counted when calculating total shares and total value | 38.732 | -6,49 | 678 | -2,31 | ||||
| 2025-11-14 | 13F | XTX Topco Ltd | 0 | -100,00 | 0 | |||||
| 2026-01-30 | 13F | Bogart Wealth, LLC | 0 | -100,00 | 0 | |||||
| 2026-02-05 | 13F | Cambridge Investment Research Advisors, Inc. | 0 | -100,00 | 0 | |||||
| 2025-11-12 | 13F | Quantbot Technologies LP | 0 | -100,00 | 0 | |||||
| 2025-11-12 | 13F | Barclays Plc | 45.084 | 349,04 | 837 | |||||
| 2025-11-14 | 13F | Jane Street Group, Llc | Call | 2.098.000 | 123,00 | 38.960 | 138,54 | |||
| 2025-08-14 | 13F | Cubist Systematic Strategies, LLC | 0 | -100,00 | 0 | -100,00 | ||||
| 2025-11-13 | 13F | Russell Investments Group, Ltd. | 0 | -100,00 | 0 | -100,00 | ||||
| 2025-11-14 | 13F | Jane Street Group, Llc | 382.059 | 7.095 | ||||||
| 2025-11-13 | 13F | Hel Ved Capital Management Ltd | 198.031 | -19,31 | 3.677 | -13,69 | ||||
| 2025-08-14 | 13F | Point72 Asia (Singapore) Pte. Ltd. | 0 | -100,00 | 0 | |||||
| 2025-08-14 | 13F | Canada Pension Plan Investment Board | 0 | -100,00 | 0 | -100,00 | ||||
| 2025-11-14 | 13F | Ubs Asset Management Americas Inc | 19.400 | 360 | ||||||
| 2025-11-14 | 13F | Squarepoint Ops LLC | Put | 41.700 | 774 | |||||
| 2025-11-14 | 13F | Peak6 Llc | Call | 1.205.900 | 199,98 | 22.394 | 220,91 | |||
| 2025-11-14 | 13F | Squarepoint Ops LLC | 28.252 | -36,34 | 525 | -31,95 | ||||
| 2025-11-14 | 13F | Peak6 Llc | Put | 8.300 | 0,00 | 154 | 6,94 | |||
| 2025-11-14 | 13F | Millennium Management Llc | Call | 0 | -100,00 | 0 | -100,00 | |||
| 2025-11-14 | 13F | Millennium Management Llc | Put | 0 | -100,00 | 0 | -100,00 | |||
| 2025-11-12 | 13F | Group One Trading, L.p. | Put | 951.600 | 7,88 | 17.671 | 15,40 | |||
| 2025-11-14 | 13F | Jane Street Group, Llc | Put | 628.300 | 5,17 | 11.668 | 12,51 | |||
| 2026-02-10 | 13F | Goldman Sachs Group Inc | Put | 0 | -100,00 | 0 | -100,00 | |||
| 2026-01-14 | 13F | Hennion & Walsh Asset Management, Inc. | 31.883 | -6,53 | 420 | -33,65 | ||||
| 2025-11-14 | 13F | Walleye Capital LLC | 0 | -100,00 | 0 | -100,00 | ||||
| 2025-09-29 | NP | EVAV - Direxion Daily Electric and Autonomous Vehicles Bull 2X Shares | 6.841 | 23,64 | 120 | 29,35 | ||||
| 2026-02-10 | 13F | Bnp Paribas Arbitrage, Sa | 102.521 | 132,57 | 1.351 | 65,16 | ||||
| 2025-11-13 | 13F | Deutsche Bank Ag\ | 3.500 | 0,00 | 65 | 6,67 | ||||
| 2026-01-20 | 13F | Steel Peak Wealth Management LLC | 13.362 | -68,51 | 176 | -77,66 | ||||
| 2026-02-10 | 13F | Norges Bank | 541.048 | 7.131 | ||||||
| 2025-11-14 | 13F | Walleye Capital LLC | Put | 0 | -100,00 | 0 | -100,00 | |||
| 2025-11-13 | 13F | Wells Fargo & Company/mn | 33.605 | 14,39 | 624 | 22,35 | ||||
| 2025-11-14 | 13F | Advisor Group Holdings, Inc. | 25.689 | -4,92 | 475 | 1,28 | ||||
| 2025-08-28 | NP | HAIL - SPDR S&P Kensho Smart Mobility ETF This fund is a listed as child fund of State Street Corp and if that institution has disclosed ownership in this security, then these positions will not be double counted when calculating total shares and total value | 18.495 | -23,20 | 321 | -36,18 | ||||
| 2026-01-07 | 13F | Aventura Private Wealth, LLC | 300 | 0,00 | 4 | -40,00 | ||||
| 2025-11-14 | 13F | Sig Brokerage, Lp | Call | 0 | -100,00 | 0 | ||||
| 2025-11-14 | 13F | Caption Management, LLC | Call | 0 | -100,00 | 0 | ||||
| 2025-08-12 | 13F | Proequities, Inc. | Put | 0 | 0 | |||||
| 2025-08-12 | 13F | Proequities, Inc. | 0 | 0 | ||||||
| 2025-08-27 | NP | CGRO - CoreValues Alpha Greater China Growth ETF | 0 | -100,00 | 0 | -100,00 | ||||
| 2025-11-14 | 13F | Daiwa Securities Group Inc. | 3.263 | -8,06 | 0 | |||||
| 2025-08-28 | NP | KOMP - SPDR S&P Kensho New Economies Composite ETF This fund is a listed as child fund of State Street Corp and if that institution has disclosed ownership in this security, then these positions will not be double counted when calculating total shares and total value | 948.949 | 7,91 | 16.474 | -10,32 | ||||
| 2025-08-14 | 13F | Ubs Oconnor Llc | 0 | -100,00 | 0 | -100,00 | ||||
| 2025-11-14 | 13F | Tower Research Capital LLC (TRC) | 1.003 | -23,08 | 19 | -18,18 | ||||
| 2026-02-10 | 13F | Goldman Sachs Group Inc | 39.416 | -32,90 | 520 | -52,39 | ||||
| 2026-02-06 | 13F | HighTower Advisors, LLC | 10.583 | -71,86 | 139 | -80,09 | ||||
| 2025-11-14 | 13F | California Public Employees Retirement System | 54.450 | 8,17 | 1.011 | 15,81 | ||||
| 2025-08-14 | 13F | Two Sigma Advisers, Lp | 0 | -100,00 | 0 | -100,00 | ||||
| 2025-11-13 | 13F | Marshall Wace, Llp | 60.794 | -2,81 | 1.129 | 3,96 | ||||
| 2025-11-18 | 13F | Advisory Services Network, LLC | 6.282 | 117 | ||||||
| 2026-02-10 | 13F | Fideuram Asset Management (Ireland) dac | 196.557 | 4.736 | ||||||
| 2026-01-20 | 13F | Independence Bank of Kentucky | 150 | 0,00 | 2 | -50,00 | ||||
| 2025-11-14 | 13F | Peak6 Llc | 0 | -100,00 | 0 | -100,00 | ||||
| 2025-11-05 | 13F | Axim Planning & Wealth | 4.374.378 | -0,54 | 81.232 | 6,39 | ||||
| 2026-01-23 | 13F | Baillie Gifford & Co | 774.166 | 10.204 | ||||||
| 2025-11-05 | 13F | Axim Planning & Wealth | Call | 49.500 | 919 | |||||
| 2026-02-05 | 13F | Bank Julius Baer & Co. Ltd, Zurich | 1.000 | -0,10 | 13 | -27,78 | ||||
| 2025-11-14 | 13F | Raymond James Financial Inc | 19.353 | -8,89 | 359 | -2,45 | ||||
| 2025-09-25 | NP | VFSNX - Vanguard FTSE All-World ex-US Small-Cap Index Fund Institutional Shares | 161.663 | 23,49 | 2.829 | 29,06 | ||||
| 2025-09-25 | NP | VT - Vanguard Total World Stock Index Fund ETF Shares | 32.268 | 35,10 | 565 | 41,00 | ||||
| 2025-11-14 | 13F | Walleye Trading LLC | Call | 13.000 | -95,53 | 241 | -95,23 | |||
| 2025-11-13 | 13F | Eschler Asset Management LLP | 200.000 | 0,00 | 3.714 | 6,97 | ||||
| 2026-02-06 | 13F | Gsa Capital Partners Llp | 0 | -100,00 | 0 | |||||
| 2025-11-19 | 13F | Sunbelt Securities, Inc. | 25 | 0,00 | 0 | |||||
| 2025-08-28 | NP | GXC - SPDR(R) S&P(R) CHINA ETF | 7.159 | -10,21 | 124 | -25,30 | ||||
| 2025-08-12 | 13F | DnB Asset Management AS | 0 | -100,00 | 0 | -100,00 | ||||
| 2025-11-14 | 13F | Walleye Trading LLC | Put | 609.700 | 21,99 | 11.322 | 30,50 | |||
| 2025-11-14 | 13F | Walleye Trading LLC | 133.850 | 289,54 | 2.486 | 316,95 | ||||
| 2025-11-26 | 13F/A | Jpmorgan Chase & Co | 8.404 | 15,25 | 156 | 23,81 | ||||
| 2025-11-13 | 13F | Quadrature Capital Ltd | 132.176 | 270,93 | 2.457 | 297,57 | ||||
| 2025-11-14 | 13F | Morgan Stanley | 304.147 | -58,23 | 5.648 | -55,31 | ||||
| 2025-12-09 | 13F/A | Tudor Investment Corp Et Al | Call | 0 | -100,00 | 0 | -100,00 | |||
| 2026-01-29 | 13F | IMC-Chicago, LLC | 128.745 | -27,54 | 1.697 | -48,59 | ||||
| 2026-01-30 | 13F | Us Bancorp \de\ | 77 | 0,00 | 1 | 0,00 | ||||
| 2025-11-12 | 13F | Simplex Trading, Llc | Put | 391.400 | 54,64 | 7 | 75,00 | |||
| 2025-11-14 | 13F | KADENSA CAPITAL Ltd | 1.056.204 | -0,73 | 19.614 | 6,19 | ||||
| 2026-01-29 | 13F | IMC-Chicago, LLC | Put | 78.100 | -72,19 | 1.029 | -80,26 | |||
| 2025-12-09 | 13F/A | Tudor Investment Corp Et Al | Put | 0 | -100,00 | 0 | -100,00 | |||
| 2026-02-03 | 13F | Mitsubishi UFJ Kokusai Asset Management Co., Ltd. | 81.028 | 29,28 | 1.170 | 0,60 | ||||
| 2025-11-14 | 13F | Turim 21 Investimentos Ltda. | 501 | 0,00 | 9 | 12,50 | ||||
| 2026-02-10 | 13F | Envestnet Asset Management Inc | 17.536 | 14,62 | 231 | -18,66 | ||||
| 2025-11-12 | 13F | Simplex Trading, Llc | 258.670 | 143,36 | 5 | 300,00 | ||||
| 2025-08-14 | 13F | Numerai GP LLC | 0 | -100,00 | 0 | |||||
| 2025-11-12 | 13F | Carrhae Capital LLP | 0 | -100,00 | 0 | |||||
| 2025-08-14 | 13F | Two Sigma Investments, Lp | 0 | -100,00 | 0 | |||||
| 2026-01-12 | 13F | Horizon Financial Services, Llc | 200 | 0,00 | 3 | -33,33 | ||||
| 2026-01-26 | 13F | Mirae Asset Global Investments Co., Ltd. | 1.859 | 2,31 | 25 | -27,27 | ||||
| 2025-11-14 | 13F | Federation des caisses Desjardins du Quebec | 251 | 0,00 | 5 | 0,00 | ||||
| 2025-08-18 | 13F/A | National Bank Of Canada /fi/ | 0 | -100,00 | 0 | -100,00 | ||||
| 2025-11-14 | 13F | Wolverine Trading, Llc | 52.199 | 968 | ||||||
| 2025-11-14 | 13F | Wolverine Trading, Llc | Call | 107.600 | 1.996 | |||||
| 2025-11-14 | 13F | Wolverine Trading, Llc | Put | 74.200 | 1.376 | |||||
| 2025-10-29 | 13F | Root Financial Partners, LLC | 200 | 4 | ||||||
| 2025-11-14 | 13F | State Street Corp | 1.034.077 | -1,01 | 19.203 | 5,90 | ||||
| 2025-11-14 | 13F | Electron Capital Partners, LLC | 35.835 | -0,23 | 665 | 6,74 | ||||
| 2025-08-27 | 13F/A | Squarepoint Ops LLC | Call | 0 | -100,00 | 0 | -100,00 | |||
| 2025-11-14 | 13F | Balyasny Asset Management Llc | Put | 55.500 | 124,70 | 1.031 | 1.645,76 | |||
| 2025-11-14 | 13F | Natixis | 0 | -100,00 | 0 | |||||
| 2025-11-14 | 13F | Balyasny Asset Management Llc | Call | 247.400 | 638,51 | 4.594 | 5.571,60 | |||
| 2025-11-13 | 13F | Invesco Ltd. | 40.038 | 2,13 | 744 | 9,26 | ||||
| 2026-02-06 | 13F | Pnc Financial Services Group, Inc. | 0 | -100,00 | 0 | |||||
| 2025-08-14 | 13F | Toroso Investments, LLC | 0 | -100,00 | 0 |
Other Listings
| US:EH | 12,11 USD |