Statistiche di base
| Azioni istituzionali (Long) | 21.437.341 - 79,22% (ex 13D/G) - change of -3,84MM shares -15,19% MRQ |
| Valore istituzionale (Long) | $ 165.310 USD ($1000) |
Proprietà istituzionale e azionisti
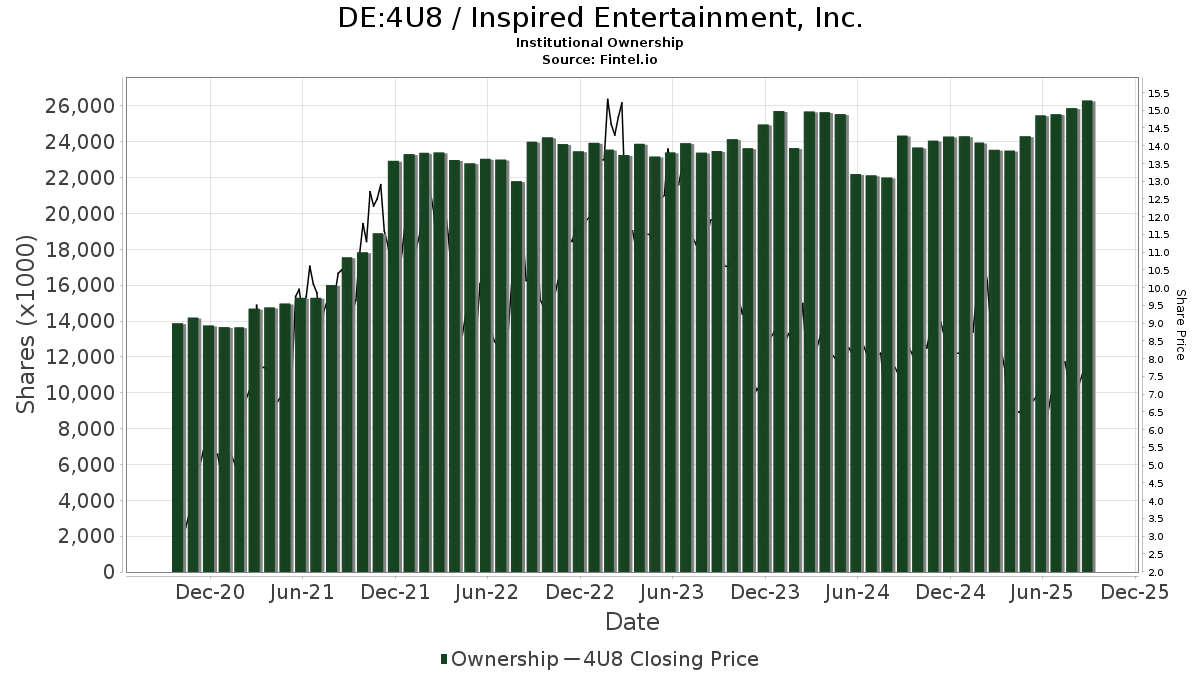
Inspired Entertainment, Inc. (DE:4U8) ha 99 proprietari istituzionali e azionisti che hanno presentato i moduli 13D/G o 13F alla Securities Exchange Commission (SEC). Queste istituzioni detengono un totale di 21,437,341 azioni. I maggiori azionisti includono Macquarie Group Ltd, Kanen Wealth Management LLC, BlackRock, Inc., Samjo Management, LLC, Private Management Group Inc, Janus Henderson Group Plc, 683 Capital Management, LLC, Brown Advisory Inc, CSM Advisors, LLC, and Potomac Capital Management, Inc. .
(Inspired Entertainment, Inc. (DB:4U8) la struttura proprietaria istituzionale mostra le attuali posizioni nella società da parte di istituzioni e fondi, nonché le ultime variazioni nella dimensione della posizione. I principali azionisti possono essere singoli investitori, fondi comuni, hedge fund o istituzioni. L'allegato 13D indica che l'investitore detiene (o ha detenuto) più del 5% della società e intende (o intendeva) perseguire attivamente un cambiamento nella strategia aziendale. L'allegato 13G indica un investimento passivo superiore al 5%.
The share price as of April 16, 2026 is 5,70 / share. Previously, on April 22, 2025, the share price was 6,15 / share. This represents a decline of 7,32% over that period.
Indice del sentiment dei fondi
L'indice del sentiment dei fondi (anche noto come "indice di accumulo di proprietà") individua i titoli più acquistati dai fondi. È il risultato di un sofisticato modello quantitativo multi-fattore che identifica le società con i più alti livelli di accumulo istituzionale. Il modello utilizza una combinazione dell'aumento totale dei proprietari dichiarati, delle variazioni nelle allocazioni di portafoglio di tali proprietari e di altre metriche. Il punteggio varia da 0 a 100: i numeri più alti indicano un livello di accumulo superiore ad altre società, mentre 50 rappresenta la media.
Frequenza di aggiornamento: giornaliera
Consulta Ownership Explorer per visualizzare l'elenco delle aziende con il ranking più alto.
AI+ Ask Fintel’s AI assistant about Inspired Entertainment, Inc..
Select a question to share a public post with an AI-crafted answer.
Thinking of good questions…
Depositi 13F e NPORT
Le informazioni relative ai depositi 13F sono gratuite. Per accedere alle informazioni relative ai depositi NP è necessario un'abbonamento premium. Le righe verdi indicano le nuove posizioni. Le righe rosse indicano le posizioni chiuse. Fai clic sull'icona del link per visualizzare la cronologia completa delle transazioni.
Esegui l'upgrade
per sbloccare i dati premium ed esportarli in Excel ![]() .
.
| Data di deposito | Fonte | Investitore | Tipo | Prezzo medio (Stima) |
Azioni | Δ Azioni (%) |
Valore dichiarato ($ 1000) |
Δ Valore (%) |
Allocazione del portafoglio (%) |
|
|---|---|---|---|---|---|---|---|---|---|---|
| 2026-02-13 | 13F | Ubs Asset Management Americas Inc | 88 | 1 | ||||||
| 2026-01-30 | 13F | R Squared Ltd | 0 | -100,00 | 0 | -100,00 | ||||
| 2025-11-14 | 13F | Lazard Asset Management Llc | 0 | -100,00 | 0 | |||||
| 2026-02-06 | 13F | Prescott Group Capital Management, L.l.c. | 358.192 | 0,00 | 3.353 | -0,21 | ||||
| 2026-02-17 | 13F | Citadel Advisors Llc | 13.776 | 129 | ||||||
| 2026-02-17 | 13F | Citadel Advisors Llc | Call | 52.400 | 57,36 | 490 | 57,05 | |||
| 2026-02-17 | 13F | CastleKnight Management LP | 24.016 | 0,00 | 225 | -0,44 | ||||
| 2026-01-30 | 13F | North Star Investment Management Corp. | 450 | 0,00 | 4 | 0,00 | ||||
| 2026-02-13 | 13F | Police & Firemen's Retirement System of New Jersey | 6.782 | 0,00 | 63 | 0,00 | ||||
| 2026-02-13 | 13F | Brown Advisory Inc | 900.633 | 8,43 | 8.430 | 8,19 | ||||
| 2026-02-13 | 13F | Marshall Wace, Llp | 0 | -100,00 | 0 | -100,00 | ||||
| 2026-01-22 | 13F | Bfsg, Llc | 11.945 | 0,84 | 112 | 0,00 | ||||
| 2026-02-13 | 13F | CDC Financial, Inc. | 319.009 | 2.986 | ||||||
| 2026-02-13 | 13F | Morgan Stanley | 94.104 | -25,05 | 881 | -25,23 | ||||
| 2026-01-14 | 13F | Spire Wealth Management | 1.150 | -73,29 | 11 | -75,00 | ||||
| 2026-02-11 | 13F | Private Management Group Inc | 1.290.512 | -1,78 | 12.079 | -1,99 | ||||
| 2026-02-13 | 13F | Focused Alpha, Llc | 20.477 | 192 | ||||||
| 2026-01-29 | 13F | Vanguard Group Inc | 573.209 | 1,30 | 5.365 | 1,09 | ||||
| 2026-04-17 | 13F | Krilogy Financial LLC | 30.286 | 219 | ||||||
| 2026-02-17 | 13F | Optiver Holding B.V. | 410 | 0,00 | 4 | 0,00 | ||||
| 2026-02-13 | 13F | Macquarie Group Ltd | 3.023.750 | 0,00 | 28.302 | -0,21 | ||||
| 2026-02-06 | 13F | Covestor Ltd | 150 | 1,35 | 0 | |||||
| 2026-02-17 | 13F/A | Samjo Management, LLC | 1.745.450 | -18,50 | 16.337 | -18,67 | ||||
| 2026-02-13 | 13F | SRS Capital Advisors, Inc. | 0 | -100,00 | 0 | |||||
| 2026-02-05 | 13F | Allworth Financial LP | 10 | 0 | ||||||
| 2026-02-10 | 13F | Thompson Siegel & Walmsley Llc | 64.419 | -28,60 | 1 | |||||
| 2026-02-12 | 13F | Renaissance Technologies Llc | 0 | -100,00 | 0 | |||||
| 2026-02-17 | 13F | Russell Investments Group, Ltd. | 277.316 | 30,87 | 2.596 | 30,60 | ||||
| 2026-02-19 | 13F | Invesco Ltd. | 18.678 | -6,33 | 175 | -6,95 | ||||
| 2026-02-05 | 13F | Gabelli Funds Llc | 187.000 | 10,65 | 1.750 | 10,41 | ||||
| 2026-02-13 | 13F | Kennedy Capital Management, Inc. | 326.386 | -15,07 | 3.055 | -15,26 | ||||
| 2026-02-13 | 13F | Sei Investments Co | 76.921 | 720 | ||||||
| 2026-02-11 | 13F | CSM Advisors, LLC | 707.428 | 8,84 | 7 | 0,00 | ||||
| 2025-11-14 | 13F | Citadel Advisors Llc | Put | 0 | -100,00 | 0 | -100,00 | |||
| 2025-11-14 | 13F | XTX Topco Ltd | 0 | -100,00 | 0 | |||||
| 2026-01-16 | 13F | Clarus Group, Inc. | 13.421 | -21,04 | 126 | -21,38 | ||||
| 2025-11-14 | 13F | DG Capital Management, LLC | 0 | -100,00 | 0 | -100,00 | ||||
| 2026-04-13 | 13F | True Wealth Design, LLC | 12 | 0,00 | 0 | |||||
| 2026-02-17 | 13F | Tower Research Capital LLC (TRC) | 1.131 | -36,96 | 11 | -37,50 | ||||
| 2026-02-06 | 13F | EverSource Wealth Advisors, LLC | 90 | 69,81 | 1 | |||||
| 2025-10-29 | 13F | AMH Equity Ltd | 80.000 | 0,00 | 750 | 14,85 | ||||
| 2026-02-17 | 13F | Royal Bank Of Canada | 1.787 | 2,52 | 16 | 0,00 | ||||
| 2026-02-17 | 13F | Price T Rowe Associates Inc /md/ | 16.085 | 28,54 | 0 | |||||
| 2026-04-06 | 13F | GAMMA Investing LLC | 2.297 | 11,78 | 16 | -15,79 | ||||
| 2026-02-17 | 13F | Ancora Advisors, LLC | 131.590 | 49,11 | 1.232 | 48,85 | ||||
| 2026-02-10 | 13F | Connor, Clark & Lunn Investment Management Ltd. | 0 | -100,00 | 0 | |||||
| 2025-11-14 | 13F | Man Group plc | 0 | -100,00 | 0 | -100,00 | ||||
| 2026-02-10 | 13F | Goldman Sachs Group Inc | 101.775 | 6,64 | 953 | 6,37 | ||||
| 2025-11-14 | 13F | Susquehanna International Group, Llp | 0 | -100,00 | 0 | -100,00 | ||||
| 2026-02-11 | 13F | Los Angeles Capital Management Llc | 19.426 | -37,17 | 144 | -50,69 | ||||
| 2026-02-11 | 13F | Jpmorgan Chase & Co | 38.278 | 2,52 | 358 | 2,29 | ||||
| 2026-01-23 | 13F | State of Alaska, Department of Revenue | 2.114 | 0 | ||||||
| 2026-02-09 | 13F | Geode Capital Management, Llc | 566.862 | -0,28 | 5.307 | -0,49 | ||||
| 2026-02-05 | 13F | Gamco Investors, Inc. Et Al | 287.300 | 0,35 | 2.689 | 0,15 | ||||
| 2026-02-12 | 13F | Jane Street Group, Llc | Call | 40.100 | 375 | |||||
| 2026-02-17 | 13F | Northern Trust Corp | 201.538 | -2,66 | 1.886 | -2,83 | ||||
| 2026-02-12 | 13F | Jane Street Group, Llc | 41.196 | 36,09 | 386 | 36,04 | ||||
| 2025-11-04 | 13F | State of Wyoming | 0 | -100,00 | 0 | -100,00 | ||||
| 2026-01-15 | 13F | Nisa Investment Advisors, Llc | 40 | -42,03 | 0 | |||||
| 2026-02-06 | 13F | Pnc Financial Services Group, Inc. | 58 | 1 | ||||||
| 2026-02-10 | 13F | Rothschild Investment Llc | 14 | 0 | ||||||
| 2026-02-13 | 13F | Resources Investment Advisors, LLC. | 39.934 | -0,78 | 374 | -1,06 | ||||
| 2026-02-12 | 13F | Dimensional Fund Advisors Lp | 214.075 | 1,09 | 2.004 | 0,86 | ||||
| 2026-02-12 | 13F | Nuveen, LLC | 63.950 | 0,00 | 599 | -0,17 | ||||
| 2026-02-04 | 13F | LRI Investments, LLC | 342 | 0,00 | 3 | 0,00 | ||||
| 2026-02-13 | 13F | Wells Fargo & Company/mn | 27.329 | 78,07 | 256 | 78,32 | ||||
| 2025-11-07 | 13F | Gsa Capital Partners Llp | 0 | -100,00 | 0 | |||||
| 2025-11-14 | 13F | Quarry LP | 0 | -100,00 | 0 | |||||
| 2026-04-06 | 13F | Versant Capital Management, Inc | 416 | -61,27 | 3 | -80,00 | ||||
| 2026-02-17 | 13F | Cooper Creek Partners Management Llc | 204.756 | 0,00 | 2 | 0,00 | ||||
| 2026-02-12 | 13F | MetLife Investment Management, LLC | 10.833 | -12,22 | 101 | -12,17 | ||||
| 2025-11-12 | 13F | LPL Financial LLC | 0 | -100,00 | 0 | |||||
| 2026-02-03 | 13F | SummerHaven Investment Management, LLC | 94.683 | 0,00 | 886 | -0,23 | ||||
| 2026-02-13 | 13F | Barclays Plc | 46.535 | 7,27 | 436 | 7,14 | ||||
| 2026-02-11 | 13F | Potomac Capital Management, Inc. | 650.500 | 45,36 | 6.089 | 37,71 | ||||
| 2026-02-12 | 13F | New York State Common Retirement Fund | 7.083 | 0,00 | 66 | 0,00 | ||||
| 2026-02-10 | 13F | Intech Investment Management Llc | 10.435 | -18,64 | 98 | -19,17 | ||||
| 2025-11-14 | 13F | Mml Investors Services, Llc | 0 | -100,00 | 0 | |||||
| 2026-02-05 | 13F | Amalgamated Bank | 785 | 2,21 | 0 | |||||
| 2026-02-11 | 13F | Deutsche Bank Ag\ | 13.755 | -48,10 | 129 | -48,39 | ||||
| 2025-11-05 | 13F | AdvisorShares Investments LLC | 0 | -100,00 | 0 | -100,00 | ||||
| 2026-02-10 | 13F | Bank of New York Mellon Corp | 94.584 | 68,78 | 885 | 68,57 | ||||
| 2026-02-13 | 13F | Rhumbline Advisers | 31.716 | -10,39 | 297 | -10,57 | ||||
| 2026-02-17 | 13F | Aqr Capital Management Llc | 24.541 | 57,86 | 230 | 57,93 | ||||
| 2026-02-13 | 13F | Jb Capital Partners Lp | 65.000 | 0,00 | 608 | -0,16 | ||||
| 2026-01-29 | 13F | Simon Quick Advisors, Llc | 25.000 | 0,00 | 234 | 0,00 | ||||
| 2026-02-17 | 13F | Two Sigma Investments, Lp | 13.052 | -60,19 | 122 | -60,26 | ||||
| 2025-11-12 | 13F | Group One Trading, L.p. | 0 | -100,00 | 0 | -100,00 | ||||
| 2026-02-17 | 13F | Quantinno Capital Management LP | 32.287 | 41,88 | 302 | 41,78 | ||||
| 2026-02-12 | 13F | BlackRock, Inc. | 2.090.886 | 2,05 | 19.571 | 1,83 | ||||
| 2026-02-13 | 13F | Citigroup Inc | 576 | -46,62 | 5 | -50,00 | ||||
| 2026-02-17 | 13F | Fmr Llc | 1.041 | -11,55 | 10 | -18,18 | ||||
| 2026-04-13 | 13F | IFP Advisors, Inc | 383 | -0,26 | 3 | -33,33 | ||||
| 2026-02-20 | 13F | Sunbelt Securities, Inc. | 7 | 0,00 | 0 | |||||
| 2026-02-17 | 13F | MIRAE ASSET GLOBAL ETFS HOLDINGS Ltd. | 11.624 | -1,18 | 109 | -1,82 | ||||
| 2026-02-09 | 13F | Penn Capital Management Co Inc | 54.970 | 0,00 | 515 | -0,19 | ||||
| 2026-02-10 | 13F | Bnp Paribas Arbitrage, Sa | 8.897 | -65,20 | 83 | -65,27 | ||||
| 2026-02-18 | 13F/A | Fuller & Thaler Asset Management, Inc. | 32.968 | 309 | ||||||
| 2026-02-17 | 13F | Advisor Group Holdings, Inc. | 390 | -20,57 | 4 | -25,00 | ||||
| 2026-02-13 | 13F | Walleye Capital LLC | 0 | -100,00 | 0 | |||||
| 2026-02-17 | 13F | D. E. Shaw & Co., Inc. | 28.345 | -34,15 | 265 | -34,24 | ||||
| 2025-11-13 | 13F | Landscape Capital Management, L.l.c. | 0 | -100,00 | 0 | -100,00 | ||||
| 2026-02-17 | 13F | Bank Of America Corp /de/ | 23.917 | -20,60 | 224 | -20,92 | ||||
| 2026-02-09 | 13F | Legal & General Group Plc | 2.685 | 0,00 | 25 | 0,00 | ||||
| 2026-02-13 | 13F | State Street Corp | 469.425 | 1,08 | 4.394 | 0,85 | ||||
| 2026-02-05 | 13F | Teton Advisors, LLC | 202.900 | 0,00 | 1.899 | -0,21 | ||||
| 2026-04-13 | 13F | Massmutual Trust Co Fsb/adv | 0 | 0 | ||||||
| 2026-02-17 | 13F | 683 Capital Management, LLC | 1.061.044 | -5,68 | 9.931 | -5,89 | ||||
| 2026-02-13 | 13F | Sterling Capital Management LLC | 162 | 165,57 | 2 | |||||
| 2026-02-17 | 13F | California State Teachers Retirement System | 1.540 | -1,60 | 14 | 0,00 | ||||
| 2026-02-13 | 13F | Charles Schwab Investment Management Inc | 72.848 | 0,07 | 682 | -0,15 | ||||
| 2026-01-29 | 13F | UBS Group AG | 9.290 | -68,25 | 87 | -68,61 | ||||
| 2026-01-26 | 13F | Cwm, Llc | 2.324 | 71,26 | 0 | |||||
| 2026-02-17 | 13F | Millennium Management Llc | 75.114 | 703 | ||||||
| 2026-02-17 | 13F | Susquehanna International Group, Llp | Call | 182.400 | 700,00 | 1.707 | 701,41 | |||
| 2026-02-18 | 13F | Kanen Wealth Management LLC | 2.683.429 | -0,02 | 25 | -99,90 | ||||
| 2026-02-18 | 13F | SkyView Investment Advisors, LLC | 71.147 | 0,86 | 1 | |||||
| 2026-04-07 | 13F | Farther Finance Advisors, LLC | 7 | 0 | ||||||
| 2026-01-20 | 13F | Harbor Capital Advisors, Inc. | 361 | -1,63 | 0 | |||||
| 2026-02-11 | 13F | Ameritas Investment Partners, Inc. | 1.661 | 16 | ||||||
| 2026-02-17 | 13F | Janus Henderson Group Plc | 1.270.275 | -4,10 | 11.890 | -4,31 | ||||
| 2026-02-06 | 13F | Lsv Asset Management | 9.973 | 0 |
Other Listings
| US:INSE | 7,40 USD |