Statistiche di base
| Proprietari istituzionali | 141 total, 141 long only, 0 short only, 0 long/short - change of -2,07% MRQ |
| Allocazione media del portafoglio | 0.7825 % - change of -13,16% MRQ |
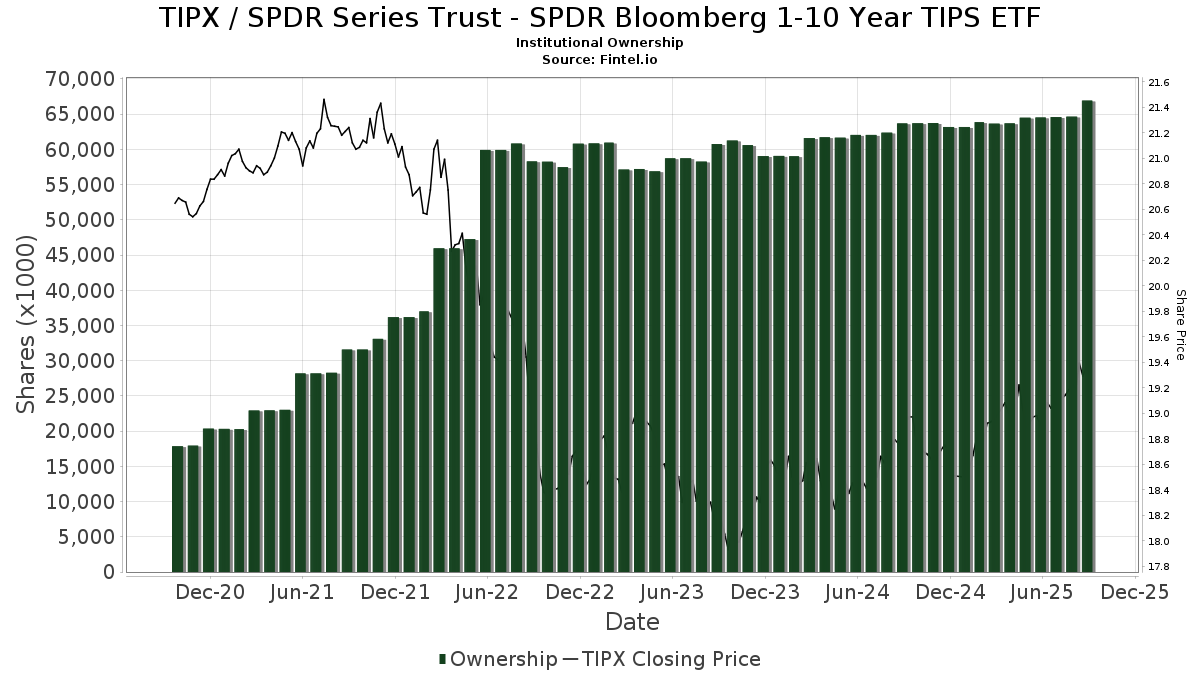
| Azioni istituzionali (Long) | 66.927.129 (ex 13D/G) - change of 2,33MM shares 3,61% MRQ |
| Valore istituzionale (Long) | $ 1.275.932 USD ($1000) |
Proprietà istituzionale e azionisti
SPDR Series Trust - SPDR Bloomberg 1-10 Year TIPS ETF (US:TIPX) ha 141 proprietari istituzionali e azionisti che hanno presentato i moduli 13D/G o 13F alla Securities Exchange Commission (SEC). Queste istituzioni detengono un totale di 66,927,129 azioni. I maggiori azionisti includono State Street Corp, SSBRX - State Street Target Retirement 2025 Fund Class I, SSBWX - State Street Target Retirement 2030 Fund Class I, SSFNX - State Street Target Retirement Fund Class I, SSBNX - State Street Target Retirement 2020 Fund Class I, RLY - SPDR SSGA Multi-Asset Real Return ETF, LPL Financial LLC, SSCJX - State Street Target Retirement 2035 Fund Class I, St Germain D J Co Inc, and Brio Consultants, LLC .
(SPDR Series Trust - SPDR Bloomberg 1-10 Year TIPS ETF (ARCA:TIPX) la struttura proprietaria istituzionale mostra le attuali posizioni nella società da parte di istituzioni e fondi, nonché le ultime variazioni nella dimensione della posizione. I principali azionisti possono essere singoli investitori, fondi comuni, hedge fund o istituzioni. L'allegato 13D indica che l'investitore detiene (o ha detenuto) più del 5% della società e intende (o intendeva) perseguire attivamente un cambiamento nella strategia aziendale. L'allegato 13G indica un investimento passivo superiore al 5%.
The share price as of September 5, 2025 is 19,35 / share. Previously, on September 9, 2024, the share price was 18,81 / share. This represents an increase of 2,87% over that period.
Indice del sentiment dei fondi
L'indice del sentiment dei fondi (anche noto come "indice di accumulo di proprietà") individua i titoli più acquistati dai fondi. È il risultato di un sofisticato modello quantitativo multi-fattore che identifica le società con i più alti livelli di accumulo istituzionale. Il modello utilizza una combinazione dell'aumento totale dei proprietari dichiarati, delle variazioni nelle allocazioni di portafoglio di tali proprietari e di altre metriche. Il punteggio varia da 0 a 100: i numeri più alti indicano un livello di accumulo superiore ad altre società, mentre 50 rappresenta la media.
Frequenza di aggiornamento: giornaliera
Consulta Ownership Explorer per visualizzare l'elenco delle aziende con il ranking più alto.
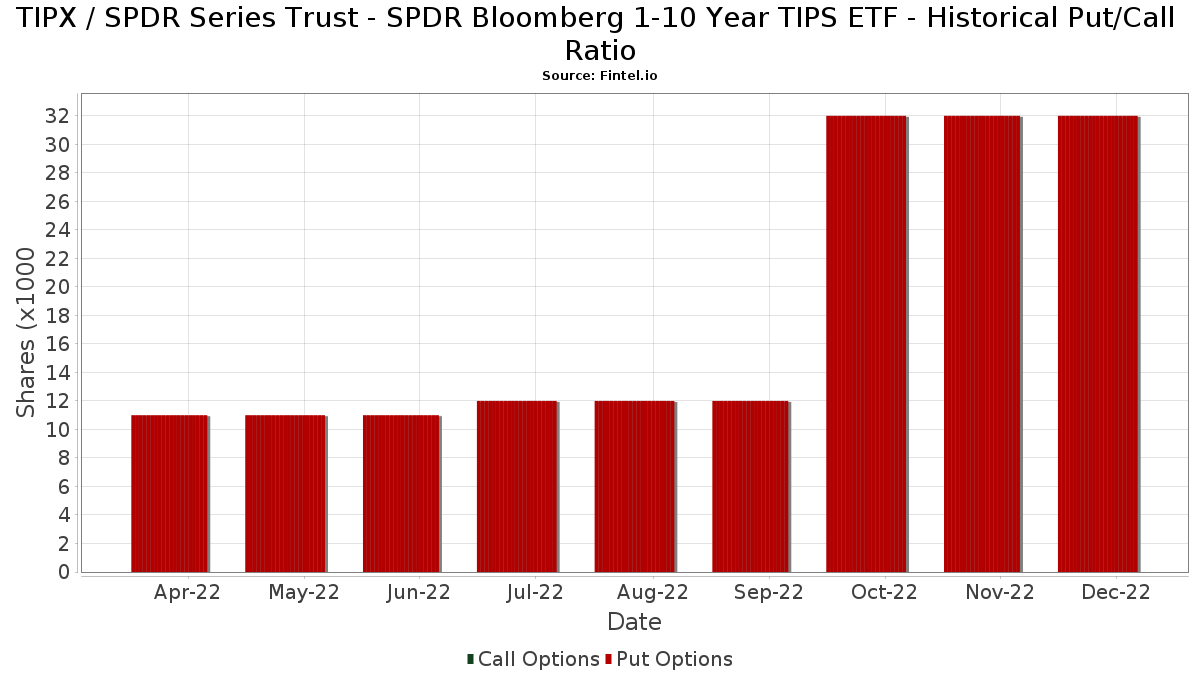
Rapporto put/call istituzionale
Oltre a segnalare le emissioni standard di titoli azionari e di debito, gli istituti con più di 100 milioni di asset in gestione devono anche dichiarare le loro partecipazioni in opzioni put e call. Poiché le opzioni put indicano generalmente un sentiment negativo e le opzioni call un sentiment positivo, possiamo avere un'idea del sentiment istituzionale complessivo attraverso il rapporto tra put e call. Il grafico a destra mostra il rapporto storico put/call per questo strumento.
L'utilizzo del rapporto put/call come indicatore del sentiment degli investitori consente di superare una delle principali lacune dell'utilizzo della proprietà istituzionale totale, ovvero il fatto che una quantità significativa di asset in gestione viene investita passivamente per seguire gli indici. Generalmente, i fondi a gestione passiva non acquistano opzioni, per cui il rapporto put/call riflette più fedelmente il sentiment dei fondi a gestione attiva.
Depositi 13D/G
Presentiamo i depositi 13D/G separatamente dai depositi 13F a causa del diverso trattamento da parte della SEC. I depositi 13D/G possono essere presentati da gruppi di investitori (con un unico leader), mentre i depositi 13F no. Ciò comporta situazioni in cui un investitore può depositare un documento 13D/G riportando un valore per il totale delle azioni (che rappresenta tutte le azioni possedute dal gruppo di investitori), e poi depositare un documento 13F riportando un valore diverso per il totale delle azioni (che rappresenta esclusivamente la propria proprietà). Ciò significa che la proprietà delle azioni nei depositi 13D/G e nei depositi 13F spesso non sono direttamente comparabili, pertanto le presentiamo separatamente.
Nota: a partire dal 16 maggio 2021, non mostriamo più i proprietari che non hanno depositato un documento 13D/G nellultimo anno. In precedenza, mostravamo lintero storico dei depositi 13D/G. In generale, le entità che sono tenute a depositare i documenti 13D/G devono farlo almeno una volta all'anno prima di presentare un deposito di chiusura. Tuttavia, a volte i fondi escono dalle posizioni senza presentare un deposito di chiusura (cioè, procedono a una liquidazione), per cui la visualizzazione dell'intero storico a volte generava confusione sull'attuale proprietà. Per evitare confusione, ora mostriamo solo i proprietari "attuali", ossia quelli che hanno effettuato un deposito nell'ultimo anno.
Upgrade to unlock premium data.
| Data di deposito | Modulo | Investitore | Azioni precedenti |
Ultime azioni |
Δ Azioni (Percentuale) |
Proprietà (Percentuale) |
Δ Proprietà (Percentuale) |
|
|---|---|---|---|---|---|---|---|---|
| 2025-06-05 | TRUIST FINANCIAL CORP | 49,574 | 51,815 | 4.52 | 0.10 | -99.85 |
Depositi 13F e NPORT
Le informazioni relative ai depositi 13F sono gratuite. Per accedere alle informazioni relative ai depositi NP è necessario un'abbonamento premium. Le righe verdi indicano le nuove posizioni. Le righe rosse indicano le posizioni chiuse. Fai clic sull'icona del link per visualizzare la cronologia completa delle transazioni.
Esegui l'upgrade
per sbloccare i dati premium ed esportarli in Excel ![]() .
.
| Data di deposito | Fonte | Investitore | Tipo | Prezzo medio (Stima) |
Azioni | Δ Azioni (%) |
Valore dichiarato ($ 1000) |
Δ Valore (%) |
Allocazione del portafoglio (%) |
|
|---|---|---|---|---|---|---|---|---|---|---|
| 2025-07-14 | 13F | Park Avenue Securities Llc | 122.594 | -4,11 | 2 | 0,00 | ||||
| 2025-08-11 | 13F | Western Wealth Management, LLC | 10.922 | 7,54 | 209 | 7,73 | ||||
| 2025-08-13 | 13F/A | StoneX Group Inc. | 0 | -100,00 | 0 | -100,00 | ||||
| 2025-07-17 | 13F | Raleigh Capital Management Inc. | 103.433 | 7,02 | 1.980 | 6,74 | ||||
| 2025-08-08 | 13F | Foundations Investment Advisors, LLC | 60.993 | -15,40 | 1.167 | -15,62 | ||||
| 2025-07-24 | 13F | Comprehensive Money Management Services LLC | 32.987 | -8,21 | 631 | -8,42 | ||||
| 2025-08-14 | 13F | Smartleaf Asset Management LLC | 570 | 0,00 | 11 | 0,00 | ||||
| 2025-05-09 | 13F | CoreCap Advisors, LLC | 0 | -100,00 | 0 | |||||
| 2025-08-13 | 13F | GeoWealth Management, LLC | 135.340 | -54,92 | 2.590 | -55,04 | ||||
| 2025-08-28 | NP | SSBRX - State Street Target Retirement 2025 Fund Class I This fund is a listed as child fund of State Street Corp and if that institution has disclosed ownership in this security, then these positions will not be double counted when calculating total shares and total value | 18.363.152 | 0,88 | 351.471 | 0,62 | ||||
| 2025-07-29 | 13F | Elevation Capital Advisory, LLC | 378.409 | 21,86 | 7.243 | 21,53 | ||||
| 2025-08-04 | 13F | Integrity Alliance, Llc. | 93.772 | 1.795 | ||||||
| 2025-05-28 | NP | SSBNX - State Street Target Retirement 2020 Fund Class I This fund is a listed as child fund of State Street Corp and if that institution has disclosed ownership in this security, then these positions will not be double counted when calculating total shares and total value | 7.522.698 | -14,27 | 144.361 | -11,02 | ||||
| 2025-08-12 | 13F | Proequities, Inc. | 0 | 0 | ||||||
| 2025-08-15 | 13F | Morgan Stanley | 130.121 | -1,49 | 2.491 | -1,74 | ||||
| 2025-08-04 | 13F | Creative Financial Designs Inc /adv | 17.747 | 69,10 | 340 | 68,66 | ||||
| 2025-08-12 | 13F | Richard W. Paul & Associates, LLC | 65 | 0,00 | 1 | 0,00 | ||||
| 2025-08-14 | 13F | Treasure Coast Financial Planning | 452.126 | 3,68 | 8.654 | 3,41 | ||||
| 2025-06-12 | 13F/A | Deutsche Bank Ag\ | 0 | -100,00 | 0 | |||||
| 2025-07-22 | 13F | Simplicity Wealth,LLC | 68.046 | 209,45 | 1.302 | 209,26 | ||||
| 2025-07-28 | 13F | Axxcess Wealth Management, Llc | 43.970 | -0,34 | 842 | -0,59 | ||||
| 2025-08-14 | 13F | Qube Research & Technologies Ltd | 207 | -87,16 | 4 | -90,00 | ||||
| 2025-07-10 | 13F | Sharkey, Howes & Javer | 77.539 | -9,42 | 1.484 | -9,62 | ||||
| 2025-07-30 | 13F | Brookstone Capital Management | 57.134 | 0,68 | 1.094 | 0,37 | ||||
| 2025-08-11 | 13F | Pinnacle Wealth Planning Services, Inc. | 230.884 | 2,52 | 4.419 | 2,27 | ||||
| 2025-07-24 | 13F | Blair William & Co/il | 535 | 494,44 | 10 | 900,00 | ||||
| 2025-08-14 | 13F | Novus Advisors, Llc | 29.569 | -4,60 | 566 | -4,88 | ||||
| 2025-05-14 | 13F | Rockefeller Capital Management L.P. | 0 | -100,00 | 0 | |||||
| 2025-08-01 | 13F | Austin Private Wealth, LLC | 188.963 | 70,08 | 3.617 | 69,61 | ||||
| 2025-08-28 | NP | SSFNX - State Street Target Retirement Fund Class I This fund is a listed as child fund of State Street Corp and if that institution has disclosed ownership in this security, then these positions will not be double counted when calculating total shares and total value | 14.177.760 | 1,20 | 271.362 | 0,93 | ||||
| 2025-08-14 | 13F | Wells Fargo & Company/mn | 21.755 | 529,85 | 416 | 530,30 | ||||
| 2025-07-09 | 13F | Capital Wealth Management, Llc | 43.360 | -8,55 | 830 | -8,80 | ||||
| 2025-08-06 | 13F | Golden State Wealth Management, LLC | 1.534 | -13,63 | 29 | -14,71 | ||||
| 2025-04-15 | 13F | Kelly Financial Services LLC | 0 | -100,00 | 0 | |||||
| 2025-08-12 | 13F | Argent Trust Co | 16.203 | -2,12 | 310 | -2,21 | ||||
| 2025-07-25 | 13F | Envestnet Portfolio Solutions, Inc. | 637.279 | 7,33 | 12.198 | 7,05 | ||||
| 2025-07-23 | 13F | Valmark Advisers, Inc. | 23.870 | -11,46 | 457 | -11,80 | ||||
| 2025-05-14 | 13F | Mml Investors Services, Llc | 0 | -100,00 | 0 | |||||
| 2025-07-28 | 13F | Mutual Advisors, LLC | 142.126 | 84,68 | 2.717 | 84,83 | ||||
| 2025-07-21 | 13F | Ameritas Advisory Services, LLC | 20 | 0 | ||||||
| 2025-07-25 | 13F | McNamara Financial Services, Inc. | 64.444 | 0,84 | 1.233 | 0,57 | ||||
| 2025-08-14 | 13F | Jane Street Group, Llc | 0 | -100,00 | 0 | |||||
| 2025-07-17 | 13F | PMG Wealth Management, Inc. | 13.227 | -29,58 | 252 | -29,61 | ||||
| 2025-07-31 | 13F | Cambridge Investment Research Advisors, Inc. | 109.463 | 0,75 | 2 | 0,00 | ||||
| 2025-08-11 | 13F | Strategic Wealth Partners, Ltd. | 748 | 14 | ||||||
| 2025-07-16 | 13F | St Germain D J Co Inc | 1.230.322 | 6,16 | 23.548 | 5,89 | ||||
| 2025-07-28 | 13F | RFG Advisory, LLC | 23.101 | 4,83 | 442 | 4,74 | ||||
| 2025-07-29 | 13F | Private Trust Co Na | 322 | -0,62 | 6 | 0,00 | ||||
| 2025-08-14 | 13F | Napa Wealth Management | 0 | -100,00 | 0 | |||||
| 2025-08-05 | 13F | Lifeworks Advisors, LLC | 20.120 | -0,34 | 385 | -0,52 | ||||
| 2025-08-14 | 13F | Raymond James Financial Inc | 83.507 | 6,70 | 1.598 | 6,46 | ||||
| 2025-07-09 | 13F | Alesco Advisors Llc | 318.981 | -1,06 | 6.105 | -1,31 | ||||
| 2025-07-15 | 13F | Revisor Wealth Management LLC | 18.887 | -12,73 | 360 | -13,49 | ||||
| 2025-08-08 | 13F | Gts Securities Llc | 0 | -100,00 | 0 | |||||
| 2025-07-14 | 13F | Iams Wealth Management, Llc | 10.450 | 200 | ||||||
| 2025-08-07 | 13F | Brio Consultants, LLC | 864.922 | 3,53 | 16.555 | 3,26 | ||||
| 2025-08-08 | 13F | Hibernia Wealth Partners, LLC | 175.092 | 93,57 | 3.351 | 93,14 | ||||
| 2025-08-14 | 13F | UBS Group AG | 158.785 | -77,45 | 3.039 | -77,50 | ||||
| 2025-08-04 | 13F | Assetmark, Inc | 330.620 | -0,79 | 6.328 | -1,05 | ||||
| 2025-07-09 | 13F | Fermata Advisors, LLC | 47.164 | -86,21 | 903 | -86,26 | ||||
| 2025-08-28 | NP | SSBWX - State Street Target Retirement 2030 Fund Class I This fund is a listed as child fund of State Street Corp and if that institution has disclosed ownership in this security, then these positions will not be double counted when calculating total shares and total value | 17.640.984 | 10,20 | 337.648 | 9,92 | ||||
| 2025-08-05 | 13F | Sigma Planning Corp | 11.497 | 220 | ||||||
| 2025-08-11 | 13F | Citigroup Inc | 5.598 | 9,06 | 107 | 9,18 | ||||
| 2025-08-12 | 13F | SRS Capital Advisors, Inc. | 0 | -100,00 | 0 | |||||
| 2025-07-22 | 13F | Foguth Wealth Management, LLC. | 0 | -100,00 | 0 | |||||
| 2025-07-25 | 13F | NorthRock Partners, LLC | 0 | -100,00 | 0 | |||||
| 2025-08-05 | 13F | Landmark Wealth Management, Inc. | 50.504 | 13,00 | 967 | 12,72 | ||||
| 2025-08-14 | 13F | Goldman Sachs Group Inc | 745.340 | 1,87 | 14.266 | 1,60 | ||||
| 2025-08-11 | 13F | Tidemark, LLC | 79 | -66,53 | 2 | -75,00 | ||||
| 2025-05-15 | 13F/A | Orion Portfolio Solutions, LLC | 16.216 | 10,83 | 311 | 15,19 | ||||
| 2025-07-18 | 13F | Truist Financial Corp | 51.969 | 4,84 | 995 | 4,52 | ||||
| 2025-08-07 | 13F | Allworth Financial LP | 5.286 | -28,47 | 101 | -28,37 | ||||
| 2025-07-29 | 13F | Balboa Wealth Partners | 18.503 | 4,83 | 354 | 4,73 | ||||
| 2025-08-06 | 13F | AE Wealth Management LLC | 13.759 | 1,91 | 263 | 1,54 | ||||
| 2025-05-12 | 13F | Founders Financial Alliance, LLC | 0 | -100,00 | 0 | |||||
| 2025-08-11 | 13F | HighTower Advisors, LLC | 77.465 | 10,05 | 1.483 | 9,78 | ||||
| 2025-08-11 | 13F | Covestor Ltd | 20 | 0,00 | 0 | |||||
| 2025-04-23 | 13F | Mascagni Wealth Management, Inc. | 0 | -100,00 | 0 | -100,00 | ||||
| 2025-08-15 | 13F | Equitable Holdings, Inc. | 74.525 | 91,61 | 1.426 | 91,15 | ||||
| 2025-07-23 | 13F | WestEnd Advisors, LLC | 9 | 0 | ||||||
| 2025-09-04 | 13F/A | Advisor Group Holdings, Inc. | 82.534 | 407,28 | 1.582 | 407,05 | ||||
| 2025-08-08 | 13F | Avantax Advisory Services, Inc. | 10.308 | 197 | ||||||
| 2025-07-10 | 13F | Security National Bank | 600.823 | -4,58 | 11.500 | -4,83 | ||||
| 2025-07-11 | 13F | SILVER OAK SECURITIES, Inc | 0 | -100,00 | 0 | |||||
| 2025-08-12 | 13F | CIBC Private Wealth Group, LLC | 0 | 0 | ||||||
| 2025-08-14 | 13F | Bank Of America Corp /de/ | 236.548 | -75,90 | 4.528 | -75,96 | ||||
| 2025-07-23 | 13F | Detalus Advisors, LLC | 17.912 | 343 | ||||||
| 2025-07-18 | 13F | Lynx Investment Advisory | 47.728 | 4,77 | 914 | 4,46 | ||||
| 2025-07-15 | 13F | Retireful, LLC | 0 | -100,00 | 0 | |||||
| 2025-07-15 | 13F | Sheets Smith Wealth Management | 0 | -100,00 | 0 | |||||
| 2025-07-24 | 13F | IFP Advisors, Inc | 3.800 | -33,68 | 73 | -33,94 | ||||
| 2025-05-01 | 13F | Quest 10 Wealth Builders, Inc. | 0 | -100,00 | 0 | |||||
| 2025-07-15 | 13F | Optima Capital Llc | 67.240 | 34,51 | 1.287 | 34,10 | ||||
| 2025-08-14 | 13F | Redwood Financial Network Corp | 33.824 | -0,19 | 647 | -0,46 | ||||
| 2025-08-06 | 13F | Paladin Advisory Group, LLC | 8.386 | 0,00 | 161 | 0,00 | ||||
| 2025-08-12 | 13F | Jpmorgan Chase & Co | 74.798 | 0,22 | 1.432 | -0,07 | ||||
| 2025-08-14 | 13F | Citadel Advisors Llc | 0 | -100,00 | 0 | |||||
| 2025-08-14 | 13F | Comerica Bank | 23.708 | -3,97 | 454 | -4,23 | ||||
| 2025-04-21 | 13F | Nelson, Van Denburg & Campbell Wealth Management Group, LLC | 0 | -100,00 | 0 | |||||
| 2025-08-11 | 13F | Private Advisor Group, LLC | 21.743 | -31,10 | 416 | -31,24 | ||||
| 2025-08-07 | 13F | AllGen Financial Advisors, Inc. | 502.279 | 9.614 | ||||||
| 2025-04-22 | 13F | Castleview Partners, Llc | 0 | -100,00 | 0 | |||||
| 2025-08-22 | NP | Variable Insurance Products Fund V - Target Volatility Portfolio Service Class | 59.925 | 0,00 | 1.147 | -0,26 | ||||
| 2025-07-16 | 13F | Maridea Wealth Management LLC | 37.067 | 0,27 | 709 | 0,00 | ||||
| 2025-07-09 | 13F | Pallas Capital Advisors LLC | 20.026 | -14,51 | 383 | -14,70 | ||||
| 2025-07-24 | 13F | Game Plan Financial Advisors, LLC | 0 | -100,00 | 0 | |||||
| 2025-08-28 | NP | GAL - SPDR SSGA Global Allocation ETF This fund is a listed as child fund of State Street Corp and if that institution has disclosed ownership in this security, then these positions will not be double counted when calculating total shares and total value | 539.336 | 5,01 | 10.323 | 4,74 | ||||
| 2025-07-08 | 13F | Nbc Securities, Inc. | 380 | 0,00 | 0 | |||||
| 2025-08-27 | 13F/A | Brinker Capital Investments, LLC | 25.066 | 54,58 | 480 | 54,02 | ||||
| 2025-07-09 | 13F | Breakwater Capital Group | 27.242 | 80,88 | 521 | 80,28 | ||||
| 2025-08-11 | 13F | Principal Securities, Inc. | 1.526 | 16,31 | 29 | 20,83 | ||||
| 2025-07-18 | 13F | Lockerman Financial Group, Inc. | 16.999 | 8,50 | 325 | 8,33 | ||||
| 2025-07-10 | 13F | Sovran Advisors, LLC | 200.289 | -3,91 | 3.807 | -3,86 | ||||
| 2025-07-11 | 13F | Farther Finance Advisors, LLC | 60.409 | -8,84 | 1.156 | -8,62 | ||||
| 2025-08-13 | 13F | Capital Analysts, Inc. | 3.518 | 0,00 | 0 | |||||
| 2025-08-13 | 13F | Jones Financial Companies Lllp | 1.556 | 0,00 | 30 | 0,00 | ||||
| 2025-07-22 | 13F | Coastal Investment Advisors, Inc. | 0 | -100,00 | 0 | |||||
| 2025-07-28 | 13F | Harbour Investments, Inc. | 24.886 | 12,92 | 476 | 12,80 | ||||
| 2025-08-12 | 13F | Global Retirement Partners, LLC | 19.402 | -57,30 | 371 | -55,83 | ||||
| 2025-08-08 | 13F | Cetera Investment Advisers | 126.654 | 6,25 | 2.424 | 5,99 | ||||
| 2025-07-25 | 13F | Cwm, Llc | 1.797 | 0,73 | 0 | |||||
| 2025-08-27 | NP | RLY - SPDR SSGA Multi-Asset Real Return ETF This fund is a listed as child fund of State Street Corp and if that institution has disclosed ownership in this security, then these positions will not be double counted when calculating total shares and total value | 2.835.147 | 29,92 | 54.265 | 29,58 | ||||
| 2025-07-10 | 13F | Global Financial Private Client, LLC | 0 | -100,00 | 0 | |||||
| 2025-08-12 | 13F | LPL Financial LLC | 2.358.568 | 2,01 | 45.143 | 1,74 | ||||
| 2025-07-07 | 13F | Accelerate Investment Advisors LLC | 13.030 | -1,21 | 249 | -1,58 | ||||
| 2025-08-14 | 13F | State Street Corp | 51.951.485 | 5,97 | 994.351 | 5,70 | ||||
| 2025-07-10 | 13F | Signal Advisors Wealth, LLC | 31.169 | -41,82 | 597 | -42,02 | ||||
| 2025-08-12 | 13F | 17 Capital Partners, Llc | 0 | -100,00 | 0 | |||||
| 2025-08-13 | 13F | Beacon Pointe Advisors, LLC | 44.537 | -6,56 | 852 | -6,78 | ||||
| 2025-08-13 | 13F | Continuum Advisory, LLC | 307.908 | 7,59 | 5.893 | 7,32 | ||||
| 2025-07-08 | 13F | Parallel Advisors, LLC | 22 | -98,63 | 0 | -100,00 | ||||
| 2025-04-28 | 13F | Clear Creek Financial Management, LLC | 0 | -100,00 | 0 | |||||
| 2025-08-14 | 13F | Manufacturers Life Insurance Company, The | 98.000 | 0,00 | 1.876 | -0,27 | ||||
| 2025-08-14 | 13F | Mariner, LLC | 0 | -100,00 | 0 | |||||
| 2025-08-15 | 13F | Fsb Premier Wealth Management, Inc. | 17.376 | -0,33 | 333 | -0,60 | ||||
| 2025-08-14 | 13F | Bnp Paribas Arbitrage, Sa | 8 | -86,21 | 0 | -100,00 | ||||
| 2025-07-09 | 13F | Blodgett Wealth Advisors, Llc | 16.022 | -1,16 | 307 | -1,61 | ||||
| 2025-07-10 | 13F | Wealth Enhancement Advisory Services, Llc | 12.592 | -17,36 | 240 | -18,15 | ||||
| 2025-08-07 | 13F | Montag A & Associates Inc | 1.748 | 0,00 | 33 | 0,00 | ||||
| 2025-08-05 | 13F | Dunhill Financial, LLC | 1 | 0 | ||||||
| 2025-05-12 | 13F | Aveo Capital Partners, LLC | 0 | -100,00 | 0 | -100,00 | ||||
| 2025-08-18 | 13F/A | National Bank Of Canada /fi/ | 140 | 3 | ||||||
| 2025-07-08 | 13F | Canandaigua National Bank & Trust Co | 13.950 | 0,00 | 267 | 0,00 | ||||
| 2025-08-06 | 13F | Commonwealth Equity Services, Llc | 10.799 | -2,54 | 0 | |||||
| 2025-08-14 | 13F | Fmr Llc | 67.495 | 1,49 | 1.292 | 1,18 | ||||
| 2025-07-29 | 13F | Stratos Wealth Partners, LTD. | 132.833 | -82,49 | 2.542 | -82,53 | ||||
| 2025-08-01 | 13F | Envestnet Asset Management Inc | 693.995 | 3,71 | 13.283 | 3,44 | ||||
| 2025-08-14 | 13F | Stifel Financial Corp | 98.882 | 251,31 | 1.893 | 250,37 | ||||
| 2025-07-14 | 13F | Sowell Financial Services LLC | 10.843 | 2,25 | 208 | 1,97 | ||||
| 2025-07-22 | 13F | Aspire Private Capital, LLC | 295.468 | 2,68 | 5.655 | 2,41 | ||||
| 2025-08-12 | 13F | Running Point Capital Advisors, LLC | 6.209 | 23,05 | 119 | 22,92 | ||||
| 2025-05-12 | 13F | Meridian Wealth Management, LLC | 0 | -100,00 | 0 | |||||
| 2025-07-07 | 13F | Global Wealth Strategies & Associates | 0 | -100,00 | 0 | |||||
| 2025-04-23 | 13F | VisionPoint Advisory Group, LLC | 0 | -100,00 | 0 | |||||
| 2025-08-12 | 13F | Change Path, LLC | 39.604 | 9,18 | 758 | 8,91 | ||||
| 2025-07-25 | 13F | Richardson Financial Services Inc. | 9.074 | -16,20 | 173 | -16,91 | ||||
| 2025-08-07 | 13F | Efficient Advisors, LLC | 210.632 | -11,39 | 4.031 | -11,62 | ||||
| 2025-08-14 | 13F | Royal Bank Of Canada | 26.116 | -0,46 | 500 | -0,79 | ||||
| 2025-04-23 | 13F | Walkner Condon Financial Advisors LLC | 0 | -100,00 | 0 | |||||
| 2025-08-14 | 13F | Susquehanna International Group, Llp | 32.491 | -42,44 | 622 | -42,66 | ||||
| 2025-08-14 | 13F | GWM Advisors LLC | 157.151 | 3,90 | 3.008 | 3,62 | ||||
| 2025-08-15 | 13F | Kestra Advisory Services, LLC | 41.999 | 0,66 | 804 | 0,38 | ||||
| 2025-07-22 | 13F | Merit Financial Group, LLC | 40.878 | 62,80 | 782 | 62,58 | ||||
| 2025-08-13 | 13F | Flow Traders U.s. Llc | 10.976 | 0 | ||||||
| 2025-08-08 | 13F | Pnc Financial Services Group, Inc. | 10.357 | 62,92 | 198 | 63,64 | ||||
| 2025-08-11 | 13F | Wbi Investments, Inc. | 78.813 | -6,62 | 1.508 | -6,86 | ||||
| 2025-08-28 | NP | SSCJX - State Street Target Retirement 2035 Fund Class I This fund is a listed as child fund of State Street Corp and if that institution has disclosed ownership in this security, then these positions will not be double counted when calculating total shares and total value | 1.711.997 | 113,27 | 32.768 | 112,72 | ||||
| 2025-08-11 | 13F | Aptus Capital Advisors, LLC | 355 | 0,00 | 7 | 0,00 | ||||
| 2025-08-13 | 13F | Transce3nd, LLC | 470 | 410,87 | 9 | 700,00 | ||||
| 2025-08-01 | 13F | Rossby Financial, LCC | 141 | 0,00 | 3 | 0,00 | ||||
| 2025-07-15 | 13F | Main Street Group, LTD | 12.574 | 0,00 | 241 | -0,41 | ||||
| 2025-05-28 | NP | MFUL - Mindful Conservative ETF | 28.957 | -61,65 | 556 | -61,19 | ||||
| 2025-08-11 | 13F | TD Waterhouse Canada Inc. | 1.419 | 0,00 | 27 | 0,00 | ||||
| 2025-08-13 | 13F | Safe Harbor Fiduciary, LLC | 99 | 11,24 | 2 | 0,00 | ||||
| 2025-08-14 | 13F | Modern Wealth Management, LLC | 20.572 | 394 |