Statistiche di base
| Proprietari istituzionali | 116 total, 116 long only, 0 short only, 0 long/short - change of -3,31% MRQ |
| Allocazione media del portafoglio | 0.1009 % - change of 0,97% MRQ |
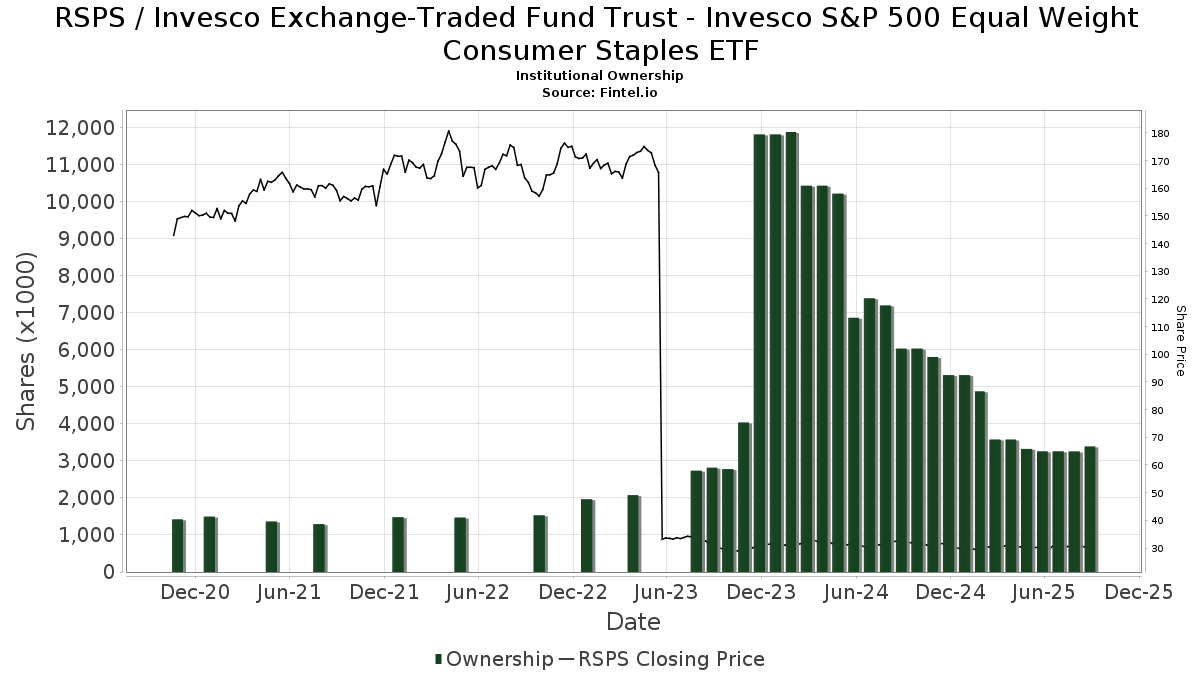
| Azioni istituzionali (Long) | 3.389.642 (ex 13D/G) - change of 0,13MM shares 4,07% MRQ |
| Valore istituzionale (Long) | $ 96.652 USD ($1000) |
Proprietà istituzionale e azionisti
Invesco Exchange-Traded Fund Trust - Invesco S&P 500 Equal Weight Consumer Staples ETF (US:RSPS) ha 116 proprietari istituzionali e azionisti che hanno presentato i moduli 13D/G o 13F alla Securities Exchange Commission (SEC). Queste istituzioni detengono un totale di 3,389,642 azioni. I maggiori azionisti includono UBS Group AG, LPL Financial LLC, Bank Of America Corp /de/, HighTower Advisors, LLC, Morgan Stanley, Cetera Investment Advisers, Envestnet Asset Management Inc, Ameriprise Financial Inc, First International Bank of Israel Ltd., and Jpmorgan Chase & Co .
(Invesco Exchange-Traded Fund Trust - Invesco S&P 500 Equal Weight Consumer Staples ETF (ARCA:RSPS) la struttura proprietaria istituzionale mostra le attuali posizioni nella società da parte di istituzioni e fondi, nonché le ultime variazioni nella dimensione della posizione. I principali azionisti possono essere singoli investitori, fondi comuni, hedge fund o istituzioni. L'allegato 13D indica che l'investitore detiene (o ha detenuto) più del 5% della società e intende (o intendeva) perseguire attivamente un cambiamento nella strategia aziendale. L'allegato 13G indica un investimento passivo superiore al 5%.
The share price as of September 5, 2025 is 30,46 / share. Previously, on September 6, 2024, the share price was 32,46 / share. This represents a decline of 6,16% over that period.
Indice del sentiment dei fondi
L'indice del sentiment dei fondi (anche noto come "indice di accumulo di proprietà") individua i titoli più acquistati dai fondi. È il risultato di un sofisticato modello quantitativo multi-fattore che identifica le società con i più alti livelli di accumulo istituzionale. Il modello utilizza una combinazione dell'aumento totale dei proprietari dichiarati, delle variazioni nelle allocazioni di portafoglio di tali proprietari e di altre metriche. Il punteggio varia da 0 a 100: i numeri più alti indicano un livello di accumulo superiore ad altre società, mentre 50 rappresenta la media.
Frequenza di aggiornamento: giornaliera
Consulta Ownership Explorer per visualizzare l'elenco delle aziende con il ranking più alto.
Rapporto put/call istituzionale
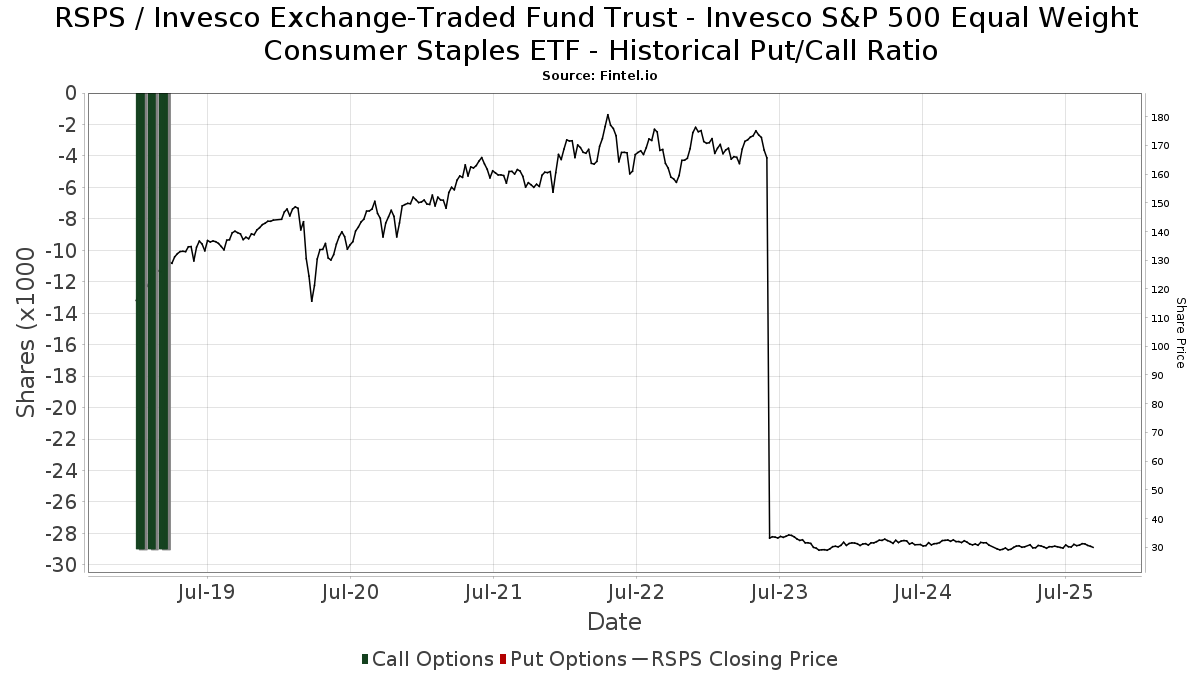
Oltre a segnalare le emissioni standard di titoli azionari e di debito, gli istituti con più di 100 milioni di asset in gestione devono anche dichiarare le loro partecipazioni in opzioni put e call. Poiché le opzioni put indicano generalmente un sentiment negativo e le opzioni call un sentiment positivo, possiamo avere un'idea del sentiment istituzionale complessivo attraverso il rapporto tra put e call. Il grafico a destra mostra il rapporto storico put/call per questo strumento.
L'utilizzo del rapporto put/call come indicatore del sentiment degli investitori consente di superare una delle principali lacune dell'utilizzo della proprietà istituzionale totale, ovvero il fatto che una quantità significativa di asset in gestione viene investita passivamente per seguire gli indici. Generalmente, i fondi a gestione passiva non acquistano opzioni, per cui il rapporto put/call riflette più fedelmente il sentiment dei fondi a gestione attiva.
Depositi 13F e NPORT
Le informazioni relative ai depositi 13F sono gratuite. Per accedere alle informazioni relative ai depositi NP è necessario un'abbonamento premium. Le righe verdi indicano le nuove posizioni. Le righe rosse indicano le posizioni chiuse. Fai clic sull'icona del link per visualizzare la cronologia completa delle transazioni.
Esegui l'upgrade
per sbloccare i dati premium ed esportarli in Excel ![]() .
.
| Data di deposito | Fonte | Investitore | Tipo | Prezzo medio (Stima) |
Azioni | Δ Azioni (%) |
Valore dichiarato ($ 1000) |
Δ Valore (%) |
Allocazione del portafoglio (%) |
|
|---|---|---|---|---|---|---|---|---|---|---|
| 2025-08-08 | 13F | Financial Gravity Companies, Inc. | 31 | -67,37 | 1 | -100,00 | ||||
| 2025-07-30 | 13F | Pacific Sun Financial Corp | 63.010 | -4,08 | 1.888 | -6,72 | ||||
| 2025-08-01 | 13F | Gwn Securities Inc. | 0 | -100,00 | 0 | |||||
| 2025-07-24 | 13F | Monument Capital Management | 6.871 | -35,92 | 206 | -37,88 | ||||
| 2025-08-14 | 13F | Wells Fargo & Company/mn | 9.921 | -41,58 | 297 | -43,21 | ||||
| 2025-08-12 | 13F | Founders Financial Alliance, LLC | 242 | 0,00 | 7 | 0,00 | ||||
| 2025-08-11 | 13F | HighTower Advisors, LLC | 231.082 | 1,01 | 6.926 | -1,79 | ||||
| 2025-08-08 | 13F | Creative Planning | 11.786 | 22,52 | 353 | 19,26 | ||||
| 2025-08-14 | 13F | GWM Advisors LLC | 710 | -58,84 | 21 | -60,38 | ||||
| 2025-08-05 | 13F | Dunhill Financial, LLC | 365 | 11 | ||||||
| 2025-07-07 | 13F | Nova Wealth Management, Inc. | 5 | -96,03 | 0 | -100,00 | ||||
| 2025-08-01 | 13F | Planning Directions Inc | 24.813 | -1,41 | 744 | -4,13 | ||||
| 2025-08-14 | 13F | Comerica Bank | 210 | 0,00 | 6 | 0,00 | ||||
| 2025-08-12 | 13F | LPL Financial LLC | 263.478 | -15,26 | 7.896 | -17,60 | ||||
| 2025-08-08 | 13F | Capital Investment Advisory Services, LLC | 500 | 15 | ||||||
| 2025-07-23 | 13F | Optas, LLC | 11.234 | 0,00 | 337 | -2,89 | ||||
| 2025-08-11 | 13F | Private Advisor Group, LLC | 39.749 | -2,29 | 1.191 | -4,95 | ||||
| 2025-08-14 | 13F | Qube Research & Technologies Ltd | 272 | 0,00 | 8 | 0,00 | ||||
| 2025-07-24 | 13F | Blair William & Co/il | 175 | 0,00 | 5 | 0,00 | ||||
| 2025-08-12 | 13F | O'shaughnessy Asset Management, Llc | 7.488 | -34,71 | 224 | -36,54 | ||||
| 2025-08-14 | 13F | Certified Advisory Corp | 0 | -100,00 | 0 | |||||
| 2025-07-23 | 13F | Friedenthal Financial | 50.174 | 1,54 | 1.504 | -1,25 | ||||
| 2025-08-12 | 13F | Global Retirement Partners, LLC | 5.552 | 166 | ||||||
| 2025-08-12 | 13F | Stelac Advisory Services LLC | 52.358 | 0,00 | 1.569 | -2,73 | ||||
| 2025-08-06 | 13F | Csenge Advisory Group | 8.715 | -0,17 | 266 | 0,00 | ||||
| 2025-08-05 | 13F | Sage Capital Management, LLC | 13.875 | 0,35 | 416 | -2,58 | ||||
| 2025-07-30 | 13F | Retirement Planning Group | 12.409 | 0,00 | 372 | -2,88 | ||||
| 2025-05-05 | 13F | Transce3nd, LLC | 0 | -100,00 | 0 | |||||
| 2025-05-06 | 13F | Carnegie Capital Asset Management, LLC | 0 | -100,00 | 0 | |||||
| 2025-08-12 | 13F | MAI Capital Management | 1.593 | 0,13 | 48 | -4,08 | ||||
| 2025-07-22 | 13F | Private Wealth Group, LLC | 67.772 | -39,88 | 2.031 | -41,54 | ||||
| 2025-08-15 | 13F | Morgan Stanley | 180.749 | -6,02 | 5.417 | -8,60 | ||||
| 2025-07-11 | 13F | SILVER OAK SECURITIES, Inc | 16.115 | 254,18 | 483 | 249,28 | ||||
| 2025-07-21 | 13F | Ameritas Advisory Services, LLC | 9.051 | -64,66 | 271 | -65,61 | ||||
| 2025-08-13 | 13F | Capital Analysts, Inc. | 610 | 0,00 | 0 | |||||
| 2025-08-06 | 13F | Commonwealth Equity Services, Llc | 60.728 | -0,36 | 2 | 0,00 | ||||
| 2025-08-14 | 13F | Vista Investment Management | 12.854 | -0,21 | 385 | -3,02 | ||||
| 2025-08-08 | 13F | Hartland & Co., LLC | 19.287 | -47,16 | 578 | -48,58 | ||||
| 2025-08-08 | 13F | Pnc Financial Services Group, Inc. | 8.410 | 0,00 | 252 | -2,70 | ||||
| 2025-08-14 | 13F | UBS Group AG | 316.681 | 162,31 | 9.491 | 155,11 | ||||
| 2025-08-14 | 13F | Fmr Llc | 5.841 | -11,07 | 175 | -13,37 | ||||
| 2025-07-22 | 13F | Grimes & Company, Inc. | 55.803 | 1.672 | ||||||
| 2025-08-12 | 13F | Proequities, Inc. | 0 | 0 | ||||||
| 2025-08-14 | 13F | CoreCap Advisors, LLC | 440 | 0,00 | 13 | 0,00 | ||||
| 2025-08-01 | 13F | Advisory Alpha, LLC | 8.017 | -0,14 | 240 | -2,83 | ||||
| 2025-05-13 | 13F | SFI Advisors, LLC | 0 | -100,00 | 0 | |||||
| 2025-08-06 | 13F | AE Wealth Management LLC | 1.365 | 71,70 | 41 | 66,67 | ||||
| 2025-08-12 | 13F | AlphaCore Capital LLC | 80 | 0,00 | 2 | 0,00 | ||||
| 2025-08-12 | 13F | Howe & Rusling Inc | 1.338 | 0,00 | 40 | -2,44 | ||||
| 2025-07-24 | 13F | Jfs Wealth Advisors, Llc | 803 | 0,63 | 24 | 0,00 | ||||
| 2025-08-12 | 13F | Atlas Capital Advisors Llc | 500 | 0,00 | 15 | 0,00 | ||||
| 2025-08-11 | 13F | Principal Securities, Inc. | 2.800 | 100,00 | 84 | 97,62 | ||||
| 2025-08-15 | 13F | First Heartland Consultants, Inc. | 24.421 | -4,34 | 732 | -7,00 | ||||
| 2025-08-14 | 13F | Bank Of America Corp /de/ | 241.328 | 0,48 | 7.233 | -2,28 | ||||
| 2025-08-11 | 13F | Kirtland Hills Capital Management, Llc | 7.210 | 8,10 | 216 | 6,40 | ||||
| 2025-08-14 | 13F | First International Bank of Israel Ltd. | 98.000 | 2.937 | ||||||
| 2025-08-08 | 13F | Cetera Investment Advisers | 113.918 | -5,37 | 3.414 | -7,98 | ||||
| 2025-08-14 | 13F | Quantinno Capital Management LP | 21.114 | -1,09 | 633 | -3,81 | ||||
| 2025-07-22 | 13F | Yoder Wealth Management, Inc. | 30.791 | 5,94 | 923 | 3,02 | ||||
| 2025-08-13 | 13F | Northwestern Mutual Wealth Management Co | 2.628 | -10,09 | 79 | -13,33 | ||||
| 2025-08-14 | 13F | Susquehanna International Group, Llp | 34.076 | 17,90 | 1.021 | 14,72 | ||||
| 2025-07-16 | 13F | Fortune Financial Advisors, LLC | 8.021 | -9,57 | 240 | -12,09 | ||||
| 2025-07-29 | 13F | Empirical Asset Management, LLC | 7.565 | 0,00 | 227 | -3,00 | ||||
| 2025-07-31 | 13F | Cambridge Investment Research Advisors, Inc. | 67.408 | -6,76 | 2 | 0,00 | ||||
| 2025-08-08 | 13F | Avalon Trust Co | 1.930 | 0,00 | 58 | -3,39 | ||||
| 2025-07-11 | 13F | Farther Finance Advisors, LLC | 48.478 | -0,62 | 1.453 | -3,52 | ||||
| 2025-08-07 | 13F | Cahill Financial Advisors Inc | 40.929 | 0,16 | 1.227 | -2,62 | ||||
| 2025-09-04 | 13F/A | Advisor Group Holdings, Inc. | 40.332 | -18,36 | 1.209 | -20,63 | ||||
| 2025-08-15 | 13F | Tower Research Capital LLC (TRC) | 18.253 | 57,71 | 547 | 53,65 | ||||
| 2025-07-10 | 13F | Affiance Financial, LLC | 0 | -100,00 | 0 | |||||
| 2025-08-13 | 13F | Twin Peaks Wealth Advisors, LLC | 225 | 7 | ||||||
| 2025-08-12 | 13F | CIBC Private Wealth Group, LLC | 3.500 | 0,00 | 105 | 4,00 | ||||
| 2025-08-14 | 13F | Royal Bank Of Canada | 5.341 | -10,34 | 159 | -13,59 | ||||
| 2025-07-24 | 13F | Costello Asset Management, INC | 1.161 | 0,61 | 35 | -2,86 | ||||
| 2025-07-24 | 13F | Live Oak Investment Partners | 18.852 | 6,56 | 565 | 3,49 | ||||
| 2025-08-14 | 13F | Raymond James Financial Inc | 20.951 | -1,08 | 628 | -3,83 | ||||
| 2025-07-15 | 13F | Fifth Third Bancorp | 275 | 0,00 | 8 | 0,00 | ||||
| 2025-07-16 | 13F | Legend Financial Advisors, Inc. | 1.088 | 33 | ||||||
| 2025-07-16 | 13F/A | CX Institutional | 1.001 | -68,65 | 0 | |||||
| 2025-08-14 | 13F | Jane Street Group, Llc | 0 | -100,00 | 0 | |||||
| 2025-07-30 | 13F | Bogart Wealth, LLC | 622 | 0,65 | 19 | -5,26 | ||||
| 2025-08-07 | 13F | Kestra Private Wealth Services, Llc | 0 | -100,00 | 0 | |||||
| 2025-08-11 | 13F | Citigroup Inc | 0 | -100,00 | 0 | |||||
| 2025-07-24 | 13F | Weaver Capital Management LLC | 62.732 | -4,24 | 1.880 | -6,84 | ||||
| 2025-08-13 | 13F | Royal Fund Management, LLC | 13.557 | -16,58 | 406 | -18,96 | ||||
| 2025-07-08 | 13F | Parallel Advisors, LLC | 145 | 0,00 | 4 | 0,00 | ||||
| 2025-08-07 | 13F | Allworth Financial LP | 7.535 | 0,43 | 226 | -0,88 | ||||
| 2025-05-16 | 13F | Laidlaw Wealth Management LLC | 0 | -100,00 | 0 | |||||
| 2025-08-01 | 13F | Envestnet Asset Management Inc | 109.967 | 10,62 | 3.296 | 7,57 | ||||
| 2025-08-05 | 13F | Tsfg, Llc | 14.910 | -2,89 | 0 | |||||
| 2025-07-17 | 13F | Walker Asset Management, LLC | 16.133 | -2,67 | 484 | -5,29 | ||||
| 2025-07-14 | 13F | Toth Financial Advisory Corp | 0 | -100,00 | 0 | |||||
| 2025-07-29 | 13F | Private Trust Co Na | 6.720 | 0,00 | 201 | -2,90 | ||||
| 2025-04-30 | 13F | Sofos Investments, Inc. | 41 | 105,00 | 1 | |||||
| 2025-08-12 | 13F | Wealthbridge Capital Management, Llc | 61.360 | -1,79 | 1.839 | -4,52 | ||||
| 2025-08-14 | 13F | Mariner, LLC | 26.532 | -4,43 | 795 | -7,02 | ||||
| 2025-08-04 | 13F | Joseph P. Lucia & Associates, LLC | 53.405 | 0,00 | 1.601 | -2,74 | ||||
| 2025-08-12 | 13F | Jpmorgan Chase & Co | 78.929 | 87,09 | 2.366 | 81,92 | ||||
| 2025-04-21 | 13F | Nelson, Van Denburg & Campbell Wealth Management Group, LLC | 0 | -100,00 | 0 | |||||
| 2025-08-04 | 13F | Kovack Advisors, Inc. | 10.838 | -1,07 | 325 | -3,86 | ||||
| 2025-07-21 | 13F | DHJJ Financial Advisors, Ltd. | 38.643 | -1,63 | 1.158 | -4,30 | ||||
| 2025-07-10 | 13F | Focus Financial Network, Inc. | 16.617 | -2,43 | 498 | -4,96 | ||||
| 2025-07-30 | 13F | Eqis Capital Management, Inc. | 6.744 | -2,19 | 202 | -4,72 | ||||
| 2025-08-07 | 13F/A | Joseph Group Capital Management | 0 | -100,00 | 0 | |||||
| 2025-08-14 | 13F | Citadel Advisors Llc | 0 | -100,00 | 0 | |||||
| 2025-08-11 | 13F | HHM Wealth Advisors, LLC | 2.600 | 0,00 | 78 | -3,75 | ||||
| 2025-07-16 | 13F | Strategic Investment Solutions, Inc. /IL | 145 | 0,00 | 4 | 0,00 | ||||
| 2025-08-12 | 13F | Coldstream Capital Management Inc | 0 | -100,00 | 0 | |||||
| 2025-07-22 | 13F | Coastal Investment Advisors, Inc. | 0 | -100,00 | 0 | |||||
| 2025-08-13 | 13F | Jones Financial Companies Lllp | 6.458 | 39,48 | 192 | 37,14 | ||||
| 2025-08-15 | 13F | Kestra Advisory Services, LLC | 12.307 | -5,38 | 369 | -8,00 | ||||
| 2025-08-13 | 13F | Cary Street Partners Financial Llc | 7.367 | 221 | ||||||
| 2025-07-25 | 13F | Cwm, Llc | 875 | -3,85 | 0 | |||||
| 2025-08-14 | 13F | Mercer Global Advisors Inc /adv | 9.801 | -1,64 | 294 | -4,56 | ||||
| 2025-08-07 | 13F | Blackston Financial Advisory Group, LLC | 12.236 | -9,02 | 367 | -11,59 | ||||
| 2025-08-14 | 13F | Two Sigma Securities, Llc | 0 | -100,00 | 0 | |||||
| 2025-08-14 | 13F | Stifel Financial Corp | 6.984 | 209 | ||||||
| 2025-08-13 | 13F | Green Harvest Asset Management LLC | 16.622 | -0,88 | 498 | -3,49 | ||||
| 2025-07-29 | 13F | Ballast, Inc. | 53.405 | 1.601 | ||||||
| 2025-08-14 | 13F | Glenmede Investment Management, LP | 400 | 12 | ||||||
| 2025-07-14 | 13F | U.S. Capital Wealth Advisors, LLC | 15.212 | -0,96 | 456 | -3,81 | ||||
| 2025-08-08 | 13F | Thoroughbred Financial Services, Llc | 17.495 | -39,71 | 1 | |||||
| 2025-08-18 | 13F | Geneos Wealth Management Inc. | 2.750 | -8,33 | 82 | -10,87 | ||||
| 2025-07-18 | 13F | Truist Financial Corp | 54.611 | 30,39 | 1.637 | 26,82 | ||||
| 2025-07-21 | 13F | TFG Advisers LLC | 13.861 | -14,82 | 415 | -17,17 | ||||
| 2025-08-14 | 13F | Goldman Sachs Group Inc | 0 | -100,00 | 0 | |||||
| 2025-08-19 | 13F | Asset Dedication, LLC | 320 | 0,00 | 10 | 0,00 | ||||
| 2025-05-09 | 13F | McClarren Financial Advisors, Inc. | 0 | -100,00 | 0 | |||||
| 2025-07-29 | 13F | Koshinski Asset Management, Inc. | 9.985 | -6,94 | 299 | -9,39 | ||||
| 2025-08-05 | 13F | GPS Wealth Strategies Group, LLC | 395 | 0,00 | 12 | -8,33 | ||||
| 2025-05-14 | 13F | Mml Investors Services, Llc | 0 | -100,00 | 0 | |||||
| 2025-08-06 | 13F | Stonebridge Financial Planning Group, LLC | 16.392 | 0,02 | 491 | -2,77 | ||||
| 2025-05-14 | 13F | Flow Traders U.s. Llc | 0 | -100,00 | 0 | |||||
| 2025-08-01 | 13F | Brookwood Investment Group LLC | 15.175 | 0,00 | 455 | -2,78 | ||||
| 2025-08-14 | 13F | Ameriprise Financial Inc | 105.322 | -4,50 | 3.156 | -7,15 | ||||
| 2025-07-18 | 13F | QTR Family Wealth, LLC | 12.514 | -7,04 | 375 | -9,42 | ||||
| 2025-08-05 | 13F | Huntington National Bank | 0 | |||||||
| 2025-07-28 | 13F | Harbour Investments, Inc. | 11.575 | -4,33 | 347 | -6,99 | ||||
| 2025-08-13 | 13F | Lido Advisors, LLC | 14.747 | 0,96 | 442 | -2,00 |