Statistiche di base
| Proprietari istituzionali | 45 total, 45 long only, 0 short only, 0 long/short - change of 4,65% MRQ |
| Allocazione media del portafoglio | 0.8929 % - change of -8,56% MRQ |
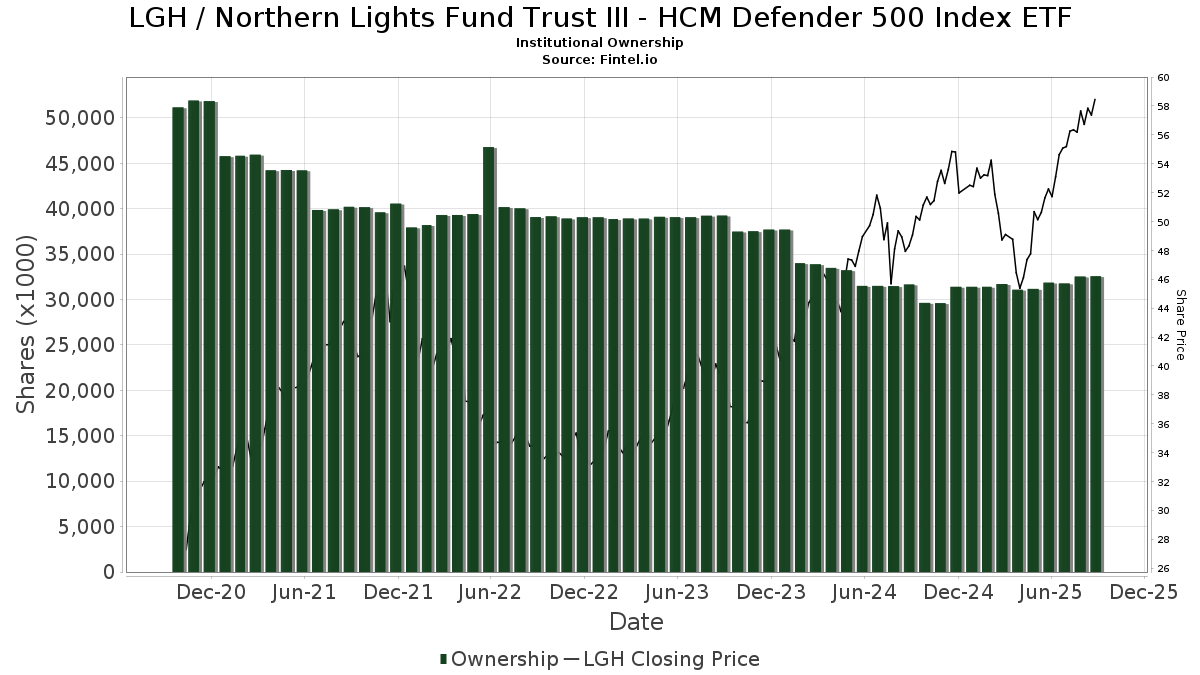
| Azioni istituzionali (Long) | 32.571.230 (ex 13D/G) - change of 0,71MM shares 2,23% MRQ |
| Valore istituzionale (Long) | $ 438.100 USD ($1000) |
Proprietà istituzionale e azionisti
Northern Lights Fund Trust III - HCM Defender 500 Index ETF (US:LGH) ha 45 proprietari istituzionali e azionisti che hanno presentato i moduli 13D/G o 13F alla Securities Exchange Commission (SEC). Queste istituzioni detengono un totale di 32,571,230 azioni. I maggiori azionisti includono DFCEX - Emerging Markets Core Equity Portfolio - Institutional Class, Dimensional Emerging Markets Value Fund - Dimensional Emerging Markets Value Fund, Howard Capital Management Inc., Envestnet Asset Management Inc, Cetera Investment Advisers, Brinker Capital Investments, LLC, Orion Portfolio Solutions, LLC, J.w. Cole Advisors, Inc., Wealth Watch Advisors, INC, and Cambridge Investment Research Advisors, Inc. .
(Northern Lights Fund Trust III - HCM Defender 500 Index ETF (ARCA:LGH) la struttura proprietaria istituzionale mostra le attuali posizioni nella società da parte di istituzioni e fondi, nonché le ultime variazioni nella dimensione della posizione. I principali azionisti possono essere singoli investitori, fondi comuni, hedge fund o istituzioni. L'allegato 13D indica che l'investitore detiene (o ha detenuto) più del 5% della società e intende (o intendeva) perseguire attivamente un cambiamento nella strategia aziendale. L'allegato 13G indica un investimento passivo superiore al 5%.
The share price as of September 5, 2025 is 57,78 / share. Previously, on September 9, 2024, the share price was 47,61 / share. This represents an increase of 21,36% over that period.
Indice del sentiment dei fondi
L'indice del sentiment dei fondi (anche noto come "indice di accumulo di proprietà") individua i titoli più acquistati dai fondi. È il risultato di un sofisticato modello quantitativo multi-fattore che identifica le società con i più alti livelli di accumulo istituzionale. Il modello utilizza una combinazione dell'aumento totale dei proprietari dichiarati, delle variazioni nelle allocazioni di portafoglio di tali proprietari e di altre metriche. Il punteggio varia da 0 a 100: i numeri più alti indicano un livello di accumulo superiore ad altre società, mentre 50 rappresenta la media.
Frequenza di aggiornamento: giornaliera
Consulta Ownership Explorer per visualizzare l'elenco delle aziende con il ranking più alto.
Rapporto put/call istituzionale
Oltre a segnalare le emissioni standard di titoli azionari e di debito, gli istituti con più di 100 milioni di asset in gestione devono anche dichiarare le loro partecipazioni in opzioni put e call. Poiché le opzioni put indicano generalmente un sentiment negativo e le opzioni call un sentiment positivo, possiamo avere un'idea del sentiment istituzionale complessivo attraverso il rapporto tra put e call. Il grafico a destra mostra il rapporto storico put/call per questo strumento.
L'utilizzo del rapporto put/call come indicatore del sentiment degli investitori consente di superare una delle principali lacune dell'utilizzo della proprietà istituzionale totale, ovvero il fatto che una quantità significativa di asset in gestione viene investita passivamente per seguire gli indici. Generalmente, i fondi a gestione passiva non acquistano opzioni, per cui il rapporto put/call riflette più fedelmente il sentiment dei fondi a gestione attiva.
Depositi 13F e NPORT
Le informazioni relative ai depositi 13F sono gratuite. Per accedere alle informazioni relative ai depositi NP è necessario un'abbonamento premium. Le righe verdi indicano le nuove posizioni. Le righe rosse indicano le posizioni chiuse. Fai clic sull'icona del link per visualizzare la cronologia completa delle transazioni.
Esegui l'upgrade
per sbloccare i dati premium ed esportarli in Excel ![]() .
.