Statistiche di base
| Proprietari istituzionali | 121 total, 121 long only, 0 short only, 0 long/short - change of 18,45% MRQ |
| Allocazione media del portafoglio | 0.3440 % - change of -1,68% MRQ |
| Azioni istituzionali (Long) | 5.885.683 (ex 13D/G) - change of -0,50MM shares -7,78% MRQ |
| Valore istituzionale (Long) | $ 209.645 USD ($1000) |
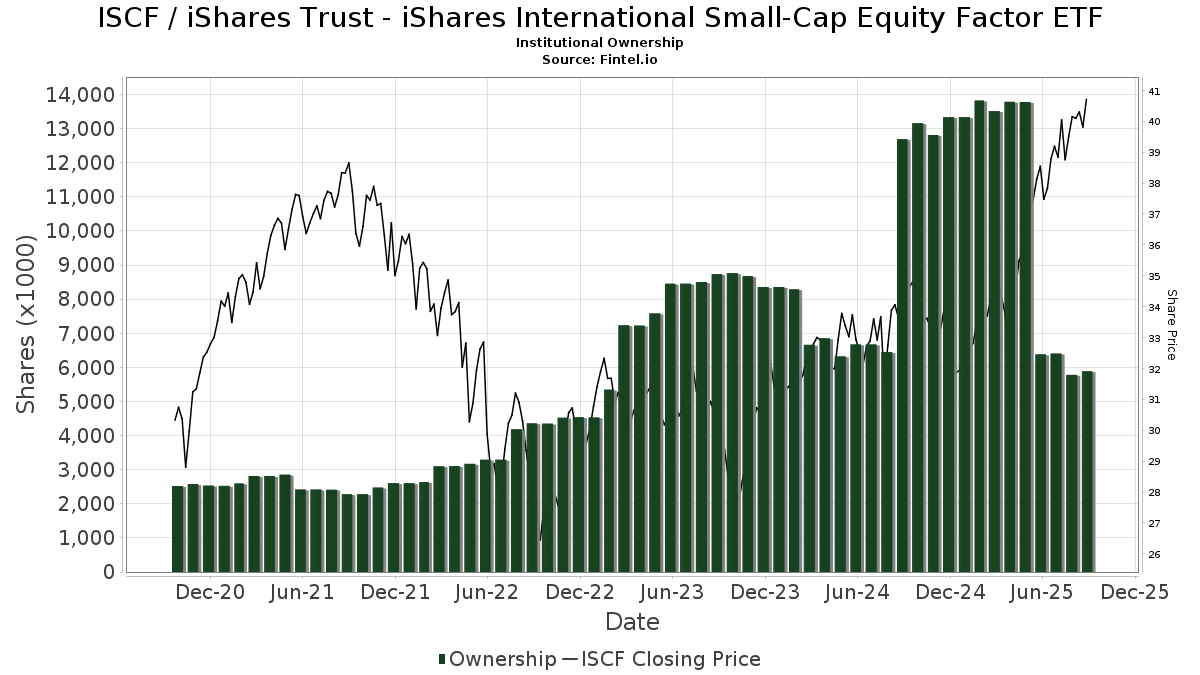
Proprietà istituzionale e azionisti
iShares Trust - iShares International Small-Cap Equity Factor ETF (US:ISCF) ha 121 proprietari istituzionali e azionisti che hanno presentato i moduli 13D/G o 13F alla Securities Exchange Commission (SEC). Queste istituzioni detengono un totale di 5,885,683 azioni. I maggiori azionisti includono Envestnet Asset Management Inc, Modern Wealth Management, LLC, FGSM - Frontier Asset Global Small Cap Equity ETF, Phoenix Wealth Advisors, Janney Montgomery Scott LLC, Financial Strategies Group, Inc., LPL Financial LLC, Larson Financial Group LLC, Northwestern Mutual Wealth Management Co, and Exchange Traded Concepts, Llc .
(iShares Trust - iShares International Small-Cap Equity Factor ETF (ARCA:ISCF) la struttura proprietaria istituzionale mostra le attuali posizioni nella società da parte di istituzioni e fondi, nonché le ultime variazioni nella dimensione della posizione. I principali azionisti possono essere singoli investitori, fondi comuni, hedge fund o istituzioni. L'allegato 13D indica che l'investitore detiene (o ha detenuto) più del 5% della società e intende (o intendeva) perseguire attivamente un cambiamento nella strategia aziendale. L'allegato 13G indica un investimento passivo superiore al 5%.
The share price as of September 5, 2025 is 40,44 / share. Previously, on September 6, 2024, the share price was 33,08 / share. This represents an increase of 22,25% over that period.
Indice del sentiment dei fondi
L'indice del sentiment dei fondi (anche noto come "indice di accumulo di proprietà") individua i titoli più acquistati dai fondi. È il risultato di un sofisticato modello quantitativo multi-fattore che identifica le società con i più alti livelli di accumulo istituzionale. Il modello utilizza una combinazione dell'aumento totale dei proprietari dichiarati, delle variazioni nelle allocazioni di portafoglio di tali proprietari e di altre metriche. Il punteggio varia da 0 a 100: i numeri più alti indicano un livello di accumulo superiore ad altre società, mentre 50 rappresenta la media.
Frequenza di aggiornamento: giornaliera
Consulta Ownership Explorer per visualizzare l'elenco delle aziende con il ranking più alto.
Rapporto put/call istituzionale
Oltre a segnalare le emissioni standard di titoli azionari e di debito, gli istituti con più di 100 milioni di asset in gestione devono anche dichiarare le loro partecipazioni in opzioni put e call. Poiché le opzioni put indicano generalmente un sentiment negativo e le opzioni call un sentiment positivo, possiamo avere un'idea del sentiment istituzionale complessivo attraverso il rapporto tra put e call. Il grafico a destra mostra il rapporto storico put/call per questo strumento.
L'utilizzo del rapporto put/call come indicatore del sentiment degli investitori consente di superare una delle principali lacune dell'utilizzo della proprietà istituzionale totale, ovvero il fatto che una quantità significativa di asset in gestione viene investita passivamente per seguire gli indici. Generalmente, i fondi a gestione passiva non acquistano opzioni, per cui il rapporto put/call riflette più fedelmente il sentiment dei fondi a gestione attiva.
Depositi 13F e NPORT
Le informazioni relative ai depositi 13F sono gratuite. Per accedere alle informazioni relative ai depositi NP è necessario un'abbonamento premium. Le righe verdi indicano le nuove posizioni. Le righe rosse indicano le posizioni chiuse. Fai clic sull'icona del link per visualizzare la cronologia completa delle transazioni.
Esegui l'upgrade
per sbloccare i dati premium ed esportarli in Excel ![]() .
.
| Data di deposito | Fonte | Investitore | Tipo | Prezzo medio (Stima) |
Azioni | Δ Azioni (%) |
Valore dichiarato ($ 1000) |
Δ Valore (%) |
Allocazione del portafoglio (%) |
|
|---|---|---|---|---|---|---|---|---|---|---|
| 2025-07-09 | 13F | Breakwater Capital Group | 22.531 | 0,34 | 874 | 15,48 | ||||
| 2025-08-13 | 13F | MONECO Advisors, LLC | 6.245 | -8,30 | 242 | 5,68 | ||||
| 2025-08-13 | 13F | Beacon Pointe Advisors, LLC | 149.510 | -19,34 | 5.797 | -7,15 | ||||
| 2025-04-21 | 13F | Ronald Blue Trust, Inc. | 0 | -100,00 | 0 | |||||
| 2025-07-11 | 13F | Farther Finance Advisors, LLC | 37.267 | -9,02 | 1.445 | 4,64 | ||||
| 2025-07-16 | 13F | Perigon Wealth Management, LLC | 36.792 | -6,16 | 1.426 | 8,03 | ||||
| 2025-07-29 | 13F | Signature Estate & Investment Advisors Llc | 5.504 | 213 | ||||||
| 2025-08-19 | 13F | Anchor Investment Management, LLC | 800 | 0,00 | 31 | 19,23 | ||||
| 2025-08-01 | 13F | Envestnet Asset Management Inc | 410.647 | -27,18 | 15.921 | -16,18 | ||||
| 2025-08-27 | 13F | Stonebridge Wealth Management, LLC | 21.124 | 819 | ||||||
| 2025-08-12 | 13F | Howe & Rusling Inc | 33 | 1 | ||||||
| 2025-08-14 | 13F | Vista Investment Management | 27.550 | 1,88 | 1.068 | 17,36 | ||||
| 2025-08-06 | 13F | Modera Wealth Management, LLC | 34.684 | 0,00 | 1.345 | 15,07 | ||||
| 2025-09-04 | 13F/A | Advisor Group Holdings, Inc. | 36.738 | 8,04 | 1.424 | 24,37 | ||||
| 2025-08-06 | 13F | Adviser Investments LLC | 21.560 | -27,82 | 836 | -17,00 | ||||
| 2025-08-13 | 13F | Flow Traders U.s. Llc | 0 | -100,00 | 0 | |||||
| 2025-08-12 | 13F | LPL Financial LLC | 204.716 | 5,32 | 7.937 | 21,23 | ||||
| 2025-07-23 | 13F | Eagle Strategies LLC | 136.888 | 5,42 | 5.307 | 21,36 | ||||
| 2025-07-14 | 13F | Sowell Financial Services LLC | 5.417 | 210 | ||||||
| 2025-07-24 | 13F | Capital Advisors, Ltd. LLC | 2.600 | 0,00 | 0 | |||||
| 2025-08-08 | 13F | Cetera Investment Advisers | 65.505 | 27,50 | 2.540 | 46,76 | ||||
| 2025-08-08 | 13F | Kingsview Wealth Management, LLC | 6.202 | -12,92 | 240 | 0,42 | ||||
| 2025-08-26 | NP | EVTTX - The E-Valuator Conservative/Moderate (30%-50%) RMS Fund Service Class Shares | 2.008 | -6,34 | 78 | 16,67 | ||||
| 2025-08-26 | NP | EVVLX - The E-Valuator Very Conservative (0%-15%) RMS Fund Service Class Shares | 855 | 33 | ||||||
| 2025-08-08 | 13F | Intrua Financial, LLC | 27.728 | 359,30 | 1.075 | 429,56 | ||||
| 2025-08-08 | 13F | Advyzon Investment Management, LLC | 6.204 | -0,89 | 241 | 14,29 | ||||
| 2025-07-10 | 13F | Exchange Traded Concepts, Llc | 161.595 | -46,72 | 6.265 | -38,66 | ||||
| 2025-07-17 | 13F | Montis Financial, LLC | 26.631 | 33,25 | 1.033 | 53,34 | ||||
| 2025-08-15 | 13F | Morgan Stanley | 4.543 | -2,11 | 176 | 12,82 | ||||
| 2025-08-26 | NP | EVMLX - The E-Valuator Moderate (50%-70%) RMS Fund Service Class Shares | 15.957 | -8,26 | 619 | 15,30 | ||||
| 2025-07-24 | 13F | IFP Advisors, Inc | 224 | 9 | ||||||
| 2025-08-14 | 13F | Royal Bank Of Canada | 7.792 | 1,96 | 302 | 17,51 | ||||
| 2025-07-16 | 13F | Beaumont Financial Advisors, LLC | 6.714 | 0,57 | 260 | 16,07 | ||||
| 2025-04-11 | 13F | Insight Advisors, LLC/ PA | 0 | -100,00 | 0 | |||||
| 2025-07-30 | 13F | Bogart Wealth, LLC | 326 | 44,89 | 13 | 71,43 | ||||
| 2025-08-08 | 13F | Avantax Advisory Services, Inc. | 5.332 | 207 | ||||||
| 2025-07-28 | 13F | Courier Capital Llc | 156.817 | 2,22 | 6.080 | 17,67 | ||||
| 2025-08-14 | 13F | Jane Street Group, Llc | 17.014 | -83,53 | 660 | -81,06 | ||||
| 2025-05-14 | 13F | Susquehanna International Group, Llp | 0 | -100,00 | 0 | |||||
| 2025-08-08 | 13F | JBF Capital, Inc. | 56.312 | 2.183 | ||||||
| 2025-07-30 | 13F | Exencial Wealth Advisors, Llc | 11.257 | 0,75 | 436 | 15,96 | ||||
| 2025-08-13 | 13F | Financial Freedom, LLC | 30.477 | 12,66 | 1.182 | 29,64 | ||||
| 2025-08-14 | 13F | Financial Strategies Group, Inc. | 208.182 | 2,58 | 8.117 | 18,70 | ||||
| 2025-08-12 | 13F | Steward Partners Investment Advisory, Llc | 0 | -100,00 | 0 | |||||
| 2025-08-14 | 13F | Integrated Wealth Concepts LLC | 10.142 | -4,43 | 393 | 10,08 | ||||
| 2025-07-24 | 13F | Williams & Novak, LLC | 54.191 | 8,50 | 2.101 | 24,78 | ||||
| 2025-07-25 | 13F | Cwm, Llc | 312 | 4,00 | 0 | |||||
| 2025-08-07 | 13F | Allworth Financial LP | 184 | -23,65 | 7 | -12,50 | ||||
| 2025-08-14 | 13F | Ariadne Wealth Management, LP | 9.795 | -20,62 | 393 | -11,69 | ||||
| 2025-08-08 | 13F | Larson Financial Group LLC | 182.907 | 961,25 | 7.091 | 1.122,59 | ||||
| 2025-08-06 | 13F | Horizon Investment Services, LLC | 19.511 | -3,00 | 756 | 11,67 | ||||
| 2025-08-14 | 13F | Mml Investors Services, Llc | 89.435 | -24,11 | 3 | 0,00 | ||||
| 2025-08-05 | 13F | GHP Investment Advisors, Inc. | 4.360 | 0,00 | 169 | 15,75 | ||||
| 2025-08-14 | 13F | UBS Group AG | 1 | 0 | ||||||
| 2025-05-09 | 13F | GeoWealth Management, LLC | 0 | -100,00 | 0 | -100,00 | ||||
| 2025-07-25 | 13F | Index Fund Advisors, Inc. | 18.016 | 1,89 | 698 | 17,31 | ||||
| 2025-08-14 | 13F | Warren Averett Asset Management, LLC | 34.806 | 0,68 | 1.349 | 15,89 | ||||
| 2025-08-04 | 13F | Arbor Capital Management Inc /adv | 10.870 | 17,29 | 421 | 35,37 | ||||
| 2025-07-31 | 13F | Glass Jacobson Investment Advisors llc | 50.320 | 1,13 | 1.951 | 21,42 | ||||
| 2025-08-06 | 13F | Commonwealth Equity Services, Llc | 97.278 | -0,87 | 4 | 0,00 | ||||
| 2025-08-01 | 13F | Rossby Financial, LCC | 200 | 0,00 | 8 | 0,00 | ||||
| 2025-08-08 | 13F | Advisors Capital Management, LLC | 123.387 | 95,01 | 4.784 | 124,55 | ||||
| 2025-08-12 | 13F | Bedel Financial Consulting, Inc. | 123.178 | -0,64 | 4.776 | 6,75 | ||||
| 2025-08-14 | 13F | Beaird Harris Wealth Management, LLC | 143.139 | -3,88 | 5.550 | 10,65 | ||||
| 2025-05-12 | 13F | Regal Investment Advisors LLC | 0 | -100,00 | 0 | |||||
| 2025-08-13 | 13F | Vance Wealth, Inc. | 9.787 | 379 | ||||||
| 2025-07-07 | 13F | Thurston, Springer, Miller, Herd & Titak, Inc. | 30.787 | 597,80 | 1.194 | 706,08 | ||||
| 2025-08-14 | 13F | Aqr Capital Management Llc | 0 | -100,00 | 0 | |||||
| 2025-07-24 | 13F | McKinley Carter Wealth Services, Inc. | 0 | -100,00 | 0 | |||||
| 2025-07-10 | 13F | Wealth Enhancement Advisory Services, Llc | 6.381 | 248 | ||||||
| 2025-07-22 | 13F | Belpointe Asset Management LLC | 9.038 | -3,83 | 350 | 10,76 | ||||
| 2025-08-14 | 13F | Mercer Global Advisors Inc /adv | 18.366 | -9,74 | 712 | 3,94 | ||||
| 2025-05-14 | 13F | Arizona PSPRS Trust | 0 | -100,00 | 0 | |||||
| 2025-07-17 | 13F | KWB Wealth | 21.872 | 737 | ||||||
| 2025-08-12 | 13F | Jpmorgan Chase & Co | 505 | 20 | ||||||
| 2025-08-13 | 13F | Northwestern Mutual Wealth Management Co | 175.225 | 29,34 | 6.793 | 48,90 | ||||
| 2025-08-26 | NP | EVAGX - The E-Valuator Aggressive Growth (85%-99%) RMS Fund Service Class Shares | 26.631 | -22,53 | 1.032 | -2,64 | ||||
| 2025-08-14 | 13F | Colony Group, LLC | 15.182 | 589 | ||||||
| 2025-08-07 | 13F | AllGen Financial Advisors, Inc. | 82.865 | -55,02 | 3.213 | -48,23 | ||||
| 2025-07-18 | 13F | BSW Wealth Partners | 0 | -100,00 | 0 | |||||
| 2025-08-19 | 13F | Asset Dedication, LLC | 1.687 | 18,22 | 65 | 35,42 | ||||
| 2025-07-25 | 13F | RHS Financial, LLC | 45.685 | -46,82 | 1.771 | -38,78 | ||||
| 2025-07-31 | 13F | Cambridge Investment Research Advisors, Inc. | 25.227 | -45,80 | 1 | -100,00 | ||||
| 2025-08-05 | 13F | Bank Of Montreal /can/ | 78 | 3 | ||||||
| 2025-08-14 | 13F | Raymond James Financial Inc | 58.561 | 2,09 | 2.270 | 17,49 | ||||
| 2025-08-05 | 13F | WorthPointe, LLC | 9.251 | 359 | ||||||
| 2025-07-17 | 13F | Janney Montgomery Scott LLC | 236.916 | -1,39 | 9 | 12,50 | ||||
| 2025-08-14 | 13F | Certified Advisory Corp | 30.948 | -12,06 | 1.200 | 1,18 | ||||
| 2025-08-06 | 13F | AE Wealth Management LLC | 90 | 0,00 | 3 | 0,00 | ||||
| 2025-07-16 | 13F | TCI Wealth Advisors, Inc. | 10.617 | -11,86 | 412 | 1,48 | ||||
| 2025-08-11 | 13F | Bell Investment Advisors, Inc | 115.893 | 23,10 | 4.493 | 41,74 | ||||
| 2025-05-02 | 13F | Parcion Private Wealth LLC | 0 | -100,00 | 0 | -100,00 | ||||
| 2025-08-26 | NP | EVGLX - The E-Valuator Growth (70%-85%) RMS Fund Service Class Shares | 20.624 | -54,66 | 800 | -43,05 | ||||
| 2025-08-04 | 13F | Arkadios Wealth Advisors | 10.798 | 20,49 | 419 | 38,87 | ||||
| 2025-08-26 | NP | EVCLX - The E-Valuator Conservative (15%-30%) RMS Fund Service Class Shares | 2.083 | -14,94 | 81 | 6,67 | ||||
| 2025-07-28 | 13F | Morris Financial Concepts, Inc. | 2.486 | -8,97 | 96 | 5,49 | ||||
| 2025-08-11 | 13F | Principal Securities, Inc. | 1.000 | 0,00 | 39 | 18,75 | ||||
| 2025-08-14 | 13F | Wells Fargo & Company/mn | 0 | -100,00 | 0 | |||||
| 2025-08-08 | 13F | Phoenix Wealth Advisors | 268.743 | 3,72 | 10.419 | 19,39 | ||||
| 2025-08-12 | 13F | Proequities, Inc. | 0 | 0 | ||||||
| 2025-07-24 | 13F | Comprehensive Money Management Services LLC | 5.188 | 201 | ||||||
| 2025-07-25 | 13F | Wealth Advisory Team LLC | 12.141 | 471 | ||||||
| 2025-08-11 | 13F | HighTower Advisors, LLC | 93.017 | 1,56 | 3.606 | 16,93 | ||||
| 2025-05-14 | 13F | Capital Analysts, Inc. | 0 | -100,00 | 0 | |||||
| 2025-07-16 | 13F | Signature Resources Capital Management, LLC | 917 | 0,00 | 36 | 16,67 | ||||
| 2025-08-14 | 13F | Bank Of America Corp /de/ | 46.167 | 0,74 | 1.790 | 15,94 | ||||
| 2025-07-14 | 13F | Sentinel Pension Advisors Inc | 8.403 | 5,51 | 326 | 21,27 | ||||
| 2025-08-14 | 13F | Great Valley Advisor Group, Inc. | 11.849 | -64,94 | 459 | -59,67 | ||||
| 2025-04-21 | 13F | LifeGoal Wealth Advisors | 0 | -100,00 | 0 | |||||
| 2025-07-14 | 13F | Narus Financial Partners, LLC | 11.194 | -4,08 | 434 | 10,18 | ||||
| 2025-08-14 | 13F | Ambassador Advisors, LLC | 9.324 | 22,01 | 361 | 40,47 | ||||
| 2025-08-11 | 13F | Aptus Capital Advisors, LLC | 12.141 | -89,24 | 471 | -87,64 | ||||
| 2025-08-12 | 13F | AlphaCore Capital LLC | 458 | 0,00 | 18 | 13,33 | ||||
| 2025-08-15 | 13F | Captrust Financial Advisors | 21.555 | -22,92 | 836 | -11,26 | ||||
| 2025-07-29 | 13F | Chicago Partners Investment Group LLC | 24.437 | 0,00 | 978 | 11,90 | ||||
| 2025-08-06 | 13F | First Horizon Advisors, Inc. | 149 | 0,00 | 6 | 0,00 | ||||
| 2025-07-22 | 13F | Merit Financial Group, LLC | 137.350 | 5.325 | ||||||
| 2025-08-15 | 13F | Equitable Holdings, Inc. | 26.090 | 1,57 | 1.012 | 16,88 | ||||
| 2025-07-28 | 13F | Harbour Investments, Inc. | 8 | 0,00 | 0 | |||||
| 2025-08-13 | 13F | Cerity Partners LLC | 103.647 | 1,34 | 4.018 | 16,67 | ||||
| 2025-07-15 | 13F | McAdam, LLC | 158.882 | 9,30 | 6.160 | 25,82 | ||||
| 2025-08-14 | 13F | Wiley Bros.-aintree Capital, Llc | 42.446 | -0,22 | 1.646 | 13,84 | ||||
| 2025-06-26 | NP | FGSM - Frontier Asset Global Small Cap Equity ETF | 294.918 | 7,86 | 10.467 | 16,29 | ||||
| 2025-07-29 | 13F | Systelligence, LLC | 68.158 | 2.642 | ||||||
| 2025-05-14 | 13F/A | Waddell & Associates, Llc | 0 | -100,00 | 0 | -100,00 | ||||
| 2025-07-21 | 13F | Fortis Capital Advisors, LLC | 9.038 | -3,83 | 350 | 10,76 | ||||
| 2025-08-01 | 13F | SYM FINANCIAL Corp | 2.111 | 9,49 | 82 | 26,56 | ||||
| 2025-08-14 | 13F | Fmr Llc | 731 | 61,37 | 28 | 86,67 | ||||
| 2025-08-14 | 13F | Stifel Financial Corp | 68.887 | -0,57 | 2.671 | 14,44 | ||||
| 2025-08-11 | 13F | TD Waterhouse Canada Inc. | 806 | 0,00 | 31 | 14,81 | ||||
| 2025-07-24 | 13F | Edge Financial Advisors LLC | 38.437 | 2,04 | 1.490 | 17,51 | ||||
| 2025-08-08 | 13F | Creative Planning | 8.537 | 331 | ||||||
| 2025-08-12 | 13F | J.w. Cole Advisors, Inc. | 21.495 | 833 | ||||||
| 2025-07-30 | 13F | Princeton Global Asset Management LLC | 130 | 0,00 | 5 | 25,00 | ||||
| 2025-08-14 | 13F | Citadel Advisors Llc | 0 | -100,00 | 0 | |||||
| 2025-07-10 | 13F | White Wing Wealth Management | 58.086 | -3,44 | 2.252 | 10,13 | ||||
| 2025-07-31 | 13F | Longview Financial Advisors, Inc. | 25.436 | -2,18 | 986 | 12,69 | ||||
| 2025-08-05 | 13F | Bank of New York Mellon Corp | 35.328 | -0,29 | 1.370 | 14,75 | ||||
| 2025-08-14 | 13F | Modern Wealth Management, LLC | 340.583 | -0,01 | 13.204 | 15,11 |