Statistiche di base
| Proprietari istituzionali | 77 total, 77 long only, 0 short only, 0 long/short - change of 8,45% MRQ |
| Allocazione media del portafoglio | 0.0947 % - change of -61,29% MRQ |
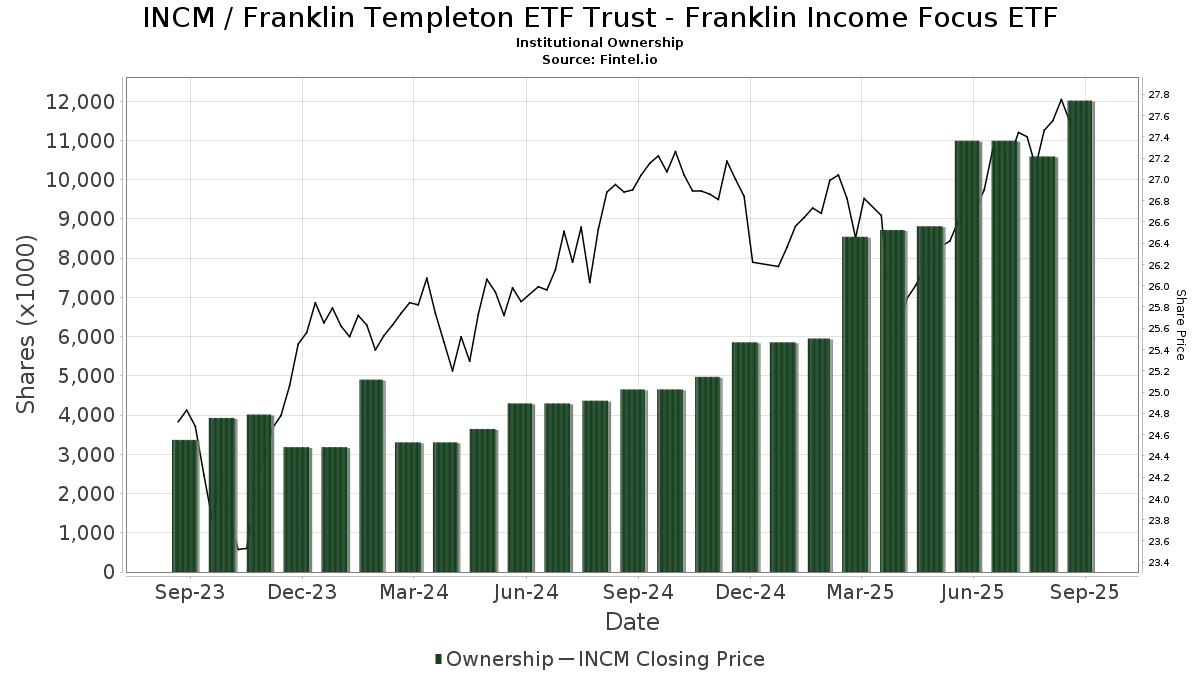
| Azioni istituzionali (Long) | 12.018.186 (ex 13D/G) - change of 1,02MM shares 9,31% MRQ |
| Valore istituzionale (Long) | $ 313.465 USD ($1000) |
Proprietà istituzionale e azionisti
Franklin Templeton ETF Trust - Franklin Income Focus ETF (US:INCM) ha 77 proprietari istituzionali e azionisti che hanno presentato i moduli 13D/G o 13F alla Securities Exchange Commission (SEC). Queste istituzioni detengono un totale di 12,018,186 azioni. I maggiori azionisti includono LPL Financial LLC, Raymond James Financial Inc, Wells Fargo & Company/mn, Royal Bank Of Canada, Ameriprise Financial Inc, Advisor Group Holdings, Inc., Wealth Enhancement Advisory Services, Llc, Cetera Investment Advisers, Sowell Financial Services LLC, and Larson Financial Group LLC .
(Franklin Templeton ETF Trust - Franklin Income Focus ETF (ARCA:INCM) la struttura proprietaria istituzionale mostra le attuali posizioni nella società da parte di istituzioni e fondi, nonché le ultime variazioni nella dimensione della posizione. I principali azionisti possono essere singoli investitori, fondi comuni, hedge fund o istituzioni. L'allegato 13D indica che l'investitore detiene (o ha detenuto) più del 5% della società e intende (o intendeva) perseguire attivamente un cambiamento nella strategia aziendale. L'allegato 13G indica un investimento passivo superiore al 5%.
The share price as of September 4, 2025 is 27,62 / share. Previously, on September 5, 2024, the share price was 26,81 / share. This represents an increase of 3,02% over that period.
Indice del sentiment dei fondi
L'indice del sentiment dei fondi (anche noto come "indice di accumulo di proprietà") individua i titoli più acquistati dai fondi. È il risultato di un sofisticato modello quantitativo multi-fattore che identifica le società con i più alti livelli di accumulo istituzionale. Il modello utilizza una combinazione dell'aumento totale dei proprietari dichiarati, delle variazioni nelle allocazioni di portafoglio di tali proprietari e di altre metriche. Il punteggio varia da 0 a 100: i numeri più alti indicano un livello di accumulo superiore ad altre società, mentre 50 rappresenta la media.
Frequenza di aggiornamento: giornaliera
Consulta Ownership Explorer per visualizzare l'elenco delle aziende con il ranking più alto.
Rapporto put/call istituzionale
Oltre a segnalare le emissioni standard di titoli azionari e di debito, gli istituti con più di 100 milioni di asset in gestione devono anche dichiarare le loro partecipazioni in opzioni put e call. Poiché le opzioni put indicano generalmente un sentiment negativo e le opzioni call un sentiment positivo, possiamo avere un'idea del sentiment istituzionale complessivo attraverso il rapporto tra put e call. Il grafico a destra mostra il rapporto storico put/call per questo strumento.
L'utilizzo del rapporto put/call come indicatore del sentiment degli investitori consente di superare una delle principali lacune dell'utilizzo della proprietà istituzionale totale, ovvero il fatto che una quantità significativa di asset in gestione viene investita passivamente per seguire gli indici. Generalmente, i fondi a gestione passiva non acquistano opzioni, per cui il rapporto put/call riflette più fedelmente il sentiment dei fondi a gestione attiva.
Depositi 13F e NPORT
Le informazioni relative ai depositi 13F sono gratuite. Per accedere alle informazioni relative ai depositi NP è necessario un'abbonamento premium. Le righe verdi indicano le nuove posizioni. Le righe rosse indicano le posizioni chiuse. Fai clic sull'icona del link per visualizzare la cronologia completa delle transazioni.
Esegui l'upgrade
per sbloccare i dati premium ed esportarli in Excel ![]() .
.
| Data di deposito | Fonte | Investitore | Tipo | Prezzo medio (Stima) |
Azioni | Δ Azioni (%) |
Valore dichiarato ($ 1000) |
Δ Valore (%) |
Allocazione del portafoglio (%) |
|
|---|---|---|---|---|---|---|---|---|---|---|
| 2025-07-29 | 13F | Private Trust Co Na | 15.941 | 1,24 | 431 | 2,86 | ||||
| 2025-08-11 | 13F | Pinnacle Financial Group, LLC / IL | 61.112 | 206,73 | 1.653 | 211,89 | ||||
| 2025-07-30 | 13F | Brookstone Capital Management | 62.082 | 1,38 | 1.679 | 3,01 | ||||
| 2025-07-14 | 13F | IronOak Wealth LLC. | 23.165 | 629 | ||||||
| 2025-08-07 | 13F | PFG Advisors | 8.034 | 217 | ||||||
| 2025-08-12 | 13F | LPL Financial LLC | 2.103.765 | 23,36 | 56.907 | 25,31 | ||||
| 2025-08-14 | 13F | Bank Of America Corp /de/ | 24.068 | 651 | ||||||
| 2025-08-08 | 13F | Avantax Advisory Services, Inc. | 31.525 | 12,89 | 853 | 14,67 | ||||
| 2025-08-11 | 13F | Principal Securities, Inc. | 1.455 | -72,75 | 39 | -71,94 | ||||
| 2025-07-28 | 13F | Harbour Investments, Inc. | 11.929 | 10,55 | 323 | 12,20 | ||||
| 2025-08-14 | 13F | Principia Wealth Advisory, LLC | 2.430 | 66 | ||||||
| 2025-07-31 | 13F | Richards, Merrill & Peterson, Inc. | 22.200 | 601 | ||||||
| 2025-08-13 | 13F | EverSource Wealth Advisors, LLC | 169 | 0,00 | 5 | 0,00 | ||||
| 2025-08-14 | 13F | Royal Bank Of Canada | 911.490 | 14,19 | 24.656 | 16,00 | ||||
| 2025-07-30 | 13F | D.a. Davidson & Co. | 135.489 | 18,71 | 3.665 | 20,57 | ||||
| 2025-08-14 | 13F | Visionary Wealth Advisors | 18.867 | 0,73 | 510 | 2,41 | ||||
| 2025-07-02 | 13F | HBW Advisory Services LLC | 11.005 | 25,57 | 298 | 27,47 | ||||
| 2025-07-17 | 13F | XML Financial, LLC | 24.915 | 8,73 | 674 | 10,33 | ||||
| 2025-08-14 | 13F | Benjamin Edwards Inc | 45.872 | 10,82 | 1.241 | 12,52 | ||||
| 2025-07-10 | 13F | Wealth Enhancement Advisory Services, Llc | 500.873 | -47,55 | 13.674 | -46,24 | ||||
| 2025-07-07 | 13F | Thurston, Springer, Miller, Herd & Titak, Inc. | 39.026 | 3.999,37 | 1.056 | 4.120,00 | ||||
| 2025-07-28 | 13F | SFG Wealth Management, LLC. | 0 | -100,00 | 0 | |||||
| 2025-08-04 | 13F | Savvy Advisors, Inc. | 8.663 | 0,13 | 234 | 1,74 | ||||
| 2025-08-13 | 13F | Jones Financial Companies Lllp | 172.392 | 61,75 | 4.668 | 64,19 | ||||
| 2025-08-05 | 13F | Bank of New York Mellon Corp | 10.137 | 274 | ||||||
| 2025-08-06 | 13F | Commonwealth Equity Services, Llc | 242.357 | -0,87 | 7 | 0,00 | ||||
| 2025-08-14 | 13F | Wells Fargo & Company/mn | 1.271.696 | 22,04 | 34.399 | 23,96 | ||||
| 2025-07-15 | 13F | LVZ Advisors, Inc. | 82.385 | 0,24 | 2.229 | 1,83 | ||||
| 2025-08-04 | 13F | Atria Investments Llc | 12.493 | 21,49 | 338 | 23,44 | ||||
| 2025-08-15 | 13F | Equitable Holdings, Inc. | 9.511 | 257 | ||||||
| 2025-07-16 | 13F | Perigon Wealth Management, LLC | 16.025 | 0,00 | 433 | 1,64 | ||||
| 2025-07-29 | 13F | Stratos Wealth Partners, LTD. | 13.111 | 12,37 | 355 | 14,19 | ||||
| 2025-08-13 | 13F | Northwestern Mutual Wealth Management Co | 78 | 2 | ||||||
| 2025-08-15 | 13F | Asset Allocation Strategies LLC | 10.998 | -69,38 | 298 | -68,93 | ||||
| 2025-08-05 | 13F | GPS Wealth Strategies Group, LLC | 3.374 | -5,41 | 91 | -3,19 | ||||
| 2025-08-13 | 13F | Smith, Moore & Co. | 140.167 | 46,48 | 3.792 | 48,78 | ||||
| 2025-08-14 | 13F | Stifel Financial Corp | 231.932 | 54,28 | 6.274 | 56,71 | ||||
| 2025-07-17 | 13F | Janney Montgomery Scott LLC | 35.793 | 54,31 | 1 | |||||
| 2025-07-25 | 13F | Cwm, Llc | 62.340 | 367,42 | 2 | |||||
| 2025-08-12 | 13F | Financial Advocates Investment Management | 24.410 | 14,89 | 660 | 16,81 | ||||
| 2025-07-16 | 13F | Kennedy Investment Group | 10.201 | 8,45 | 276 | 10,00 | ||||
| 2025-08-12 | 13F | Jpmorgan Chase & Co | 23.301 | 1,93 | 630 | 3,62 | ||||
| 2025-08-07 | 13F | Verus Capital Partners, Llc | 14.205 | 53,39 | 384 | 56,10 | ||||
| 2025-08-01 | 13F | Brinker Capital Investments, LLC | 0 | -100,00 | 0 | |||||
| 2025-08-11 | 13F | Private Advisor Group, LLC | 33.589 | 31,45 | 909 | 33,53 | ||||
| 2025-08-12 | 13F | Proequities, Inc. | 0 | 0 | ||||||
| 2025-08-13 | 13F | Capital Analysts, Inc. | 17.818 | 295,60 | 0 | |||||
| 2025-08-04 | 13F | Arkadios Wealth Advisors | 60.948 | -0,47 | 1.649 | 1,10 | ||||
| 2025-07-21 | 13F | Barrett & Company, Inc. | 1.500 | 0,00 | 41 | 2,56 | ||||
| 2025-08-19 | 13F | Advisory Services Network, LLC | 28.744 | -4,27 | 780 | -2,50 | ||||
| 2025-08-08 | 13F | Cetera Investment Advisers | 428.152 | 34,56 | 11.582 | 36,68 | ||||
| 2025-09-04 | 13F/A | Advisor Group Holdings, Inc. | 520.504 | 108,17 | 14.081 | 111,44 | ||||
| 2025-08-13 | 13F | Lido Advisors, LLC | 138.618 | 343,28 | 3.764 | 350,12 | ||||
| 2025-08-15 | 13F | Kestra Advisory Services, LLC | 64.002 | -2,62 | 1.731 | -1,09 | ||||
| 2025-07-22 | 13F | Innovative Wealth Building LLC | 26.609 | 45,91 | 720 | 48,25 | ||||
| 2025-07-22 | 13F | DAVENPORT & Co LLC | 102.041 | 9,71 | 2.760 | 11,47 | ||||
| 2025-08-15 | 13F | Morgan Stanley | 52.241 | -1,41 | 1.413 | 0,14 | ||||
| 2025-07-21 | 13F | Ameritas Advisory Services, LLC | 4.019 | -72,13 | 109 | -71,28 | ||||
| 2025-07-31 | 13F | Cambridge Investment Research Advisors, Inc. | 76.016 | 13,49 | 2 | 100,00 | ||||
| 2025-08-14 | 13F | Jane Street Group, Llc | 37.206 | -71,96 | 1.006 | -71,53 | ||||
| 2025-08-14 | 13F | Comerica Bank | 3.000 | 50,00 | 81 | 52,83 | ||||
| 2025-05-12 | 13F | Independent Advisor Alliance | 0 | -100,00 | 0 | |||||
| 2025-07-11 | 13F | Farther Finance Advisors, LLC | 4.000 | 0,00 | 108 | 1,89 | ||||
| 2025-08-14 | 13F | Citadel Advisors Llc | 70.581 | 138,85 | 1.909 | 142,88 | ||||
| 2025-07-14 | 13F | Sowell Financial Services LLC | 412.043 | 2,78 | 11.146 | 4,40 | ||||
| 2025-08-12 | 13F | Franklin Resources Inc | 680 | 3,98 | 18 | 5,88 | ||||
| 2025-08-13 | 13F | WCG Wealth Advisors LLC | 10.000 | 270 | ||||||
| 2025-08-01 | 13F | Envestnet Asset Management Inc | 23.728 | -80,10 | 642 | -79,80 | ||||
| 2025-08-14 | 13F | Old Mission Capital Llc | 35.494 | 99,09 | 960 | 102,53 | ||||
| 2025-07-25 | 13F | Atria Wealth Solutions, Inc. | 0 | -100,00 | 0 | |||||
| 2025-08-14 | 13F | Raymond James Financial Inc | 1.693.284 | 14,92 | 45.803 | 16,73 | ||||
| 2025-08-06 | 13F | Prospera Financial Services Inc | 38.585 | 26,00 | 1.044 | 28,10 | ||||
| 2025-08-08 | 13F | Larson Financial Group LLC | 333.125 | 876,68 | 9.011 | 892,40 | ||||
| 2025-08-05 | 13F | Summit Investment Advisory Services, LLC | 0 | -100,00 | 0 | |||||
| 2025-08-12 | 13F | Calton & Associates, Inc. | 18.012 | 12,12 | 487 | 14,05 | ||||
| 2025-08-12 | 13F | Cornerstone Wealth Management, LLC | 7.615 | 206 | ||||||
| 2025-08-11 | 13F | Elequin Capital Lp | 93.095 | 491,19 | 2.518 | 500,95 | ||||
| 2025-08-08 | 13F | Intrua Financial, LLC | 58.980 | 444,00 | 1.595 | 453,82 | ||||
| 2025-08-12 | 13F | Steward Partners Investment Advisory, Llc | 130.598 | 15,15 | 3.533 | 16,95 | ||||
| 2025-08-12 | 13F | Jacobi Capital Management LLC | 10.747 | 41,39 | 291 | 43,56 | ||||
| 2025-08-14 | 13F | Ameriprise Financial Inc | 684.853 | 18,06 | 18.522 | 19,84 | ||||
| 2025-07-08 | 13F | Next Level Private LLC | 256.434 | -0,92 | 6.937 | 0,64 | ||||
| 2025-08-14 | 13F | GWM Advisors LLC | 90.344 | 36,93 | 2.444 | 39,12 |