Statistiche di base
| Proprietari istituzionali | 154 total, 154 long only, 0 short only, 0 long/short - change of -0,65% MRQ |
| Allocazione media del portafoglio | 0.1487 % - change of 0,10% MRQ |
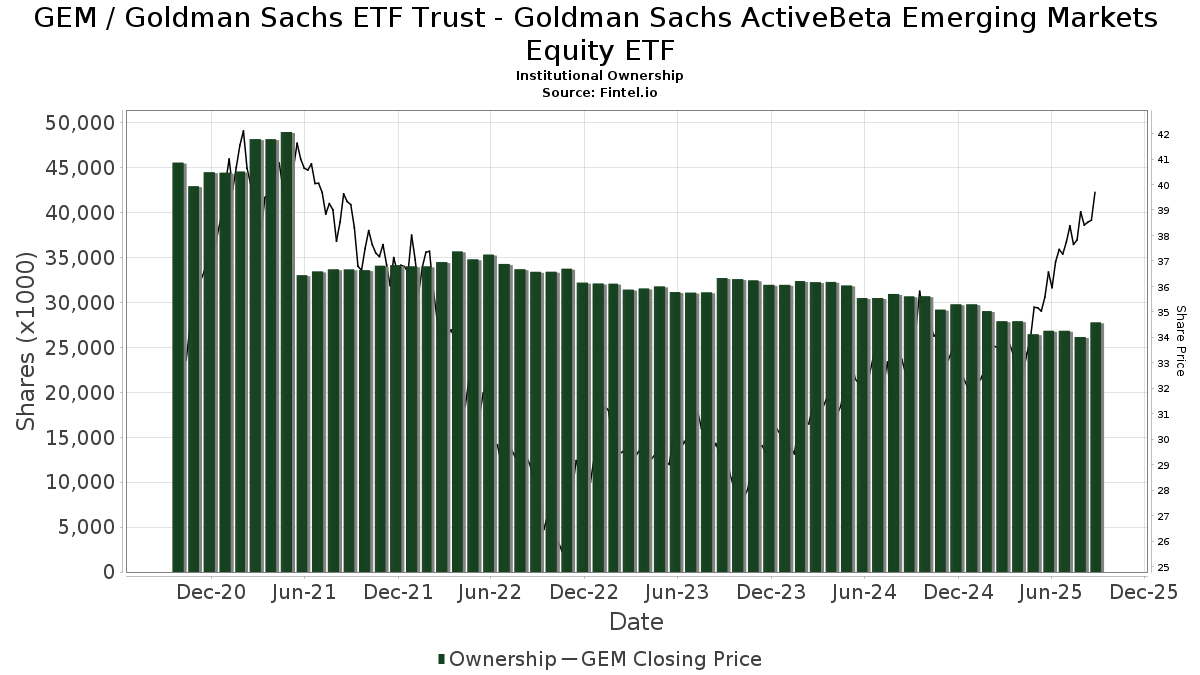
| Azioni istituzionali (Long) | 27.782.993 (ex 13D/G) - change of 0,93MM shares 3,47% MRQ |
| Valore istituzionale (Long) | $ 943.601 USD ($1000) |
Proprietà istituzionale e azionisti
Goldman Sachs ETF Trust - Goldman Sachs ActiveBeta Emerging Markets Equity ETF (US:GEM) ha 154 proprietari istituzionali e azionisti che hanno presentato i moduli 13D/G o 13F alla Securities Exchange Commission (SEC). Queste istituzioni detengono un totale di 27,782,993 azioni. I maggiori azionisti includono Wells Fargo & Company/mn, SigFig Wealth Management, LLC, Goldman Sachs Group Inc, Betterment LLC, LPL Financial LLC, GGMBX - Goldman Sachs Global Managed Beta Fund Institutional Shares, Arvest Bank Trust Division, HB Wealth Management, LLC, State Of Wisconsin Investment Board, and Envestnet Asset Management Inc .
(Goldman Sachs ETF Trust - Goldman Sachs ActiveBeta Emerging Markets Equity ETF (ARCA:GEM) la struttura proprietaria istituzionale mostra le attuali posizioni nella società da parte di istituzioni e fondi, nonché le ultime variazioni nella dimensione della posizione. I principali azionisti possono essere singoli investitori, fondi comuni, hedge fund o istituzioni. L'allegato 13D indica che l'investitore detiene (o ha detenuto) più del 5% della società e intende (o intendeva) perseguire attivamente un cambiamento nella strategia aziendale. L'allegato 13G indica un investimento passivo superiore al 5%.
The share price as of September 5, 2025 is 38,86 / share. Previously, on September 6, 2024, the share price was 32,13 / share. This represents an increase of 20,95% over that period.
Indice del sentiment dei fondi
L'indice del sentiment dei fondi (anche noto come "indice di accumulo di proprietà") individua i titoli più acquistati dai fondi. È il risultato di un sofisticato modello quantitativo multi-fattore che identifica le società con i più alti livelli di accumulo istituzionale. Il modello utilizza una combinazione dell'aumento totale dei proprietari dichiarati, delle variazioni nelle allocazioni di portafoglio di tali proprietari e di altre metriche. Il punteggio varia da 0 a 100: i numeri più alti indicano un livello di accumulo superiore ad altre società, mentre 50 rappresenta la media.
Frequenza di aggiornamento: giornaliera
Consulta Ownership Explorer per visualizzare l'elenco delle aziende con il ranking più alto.
Rapporto put/call istituzionale
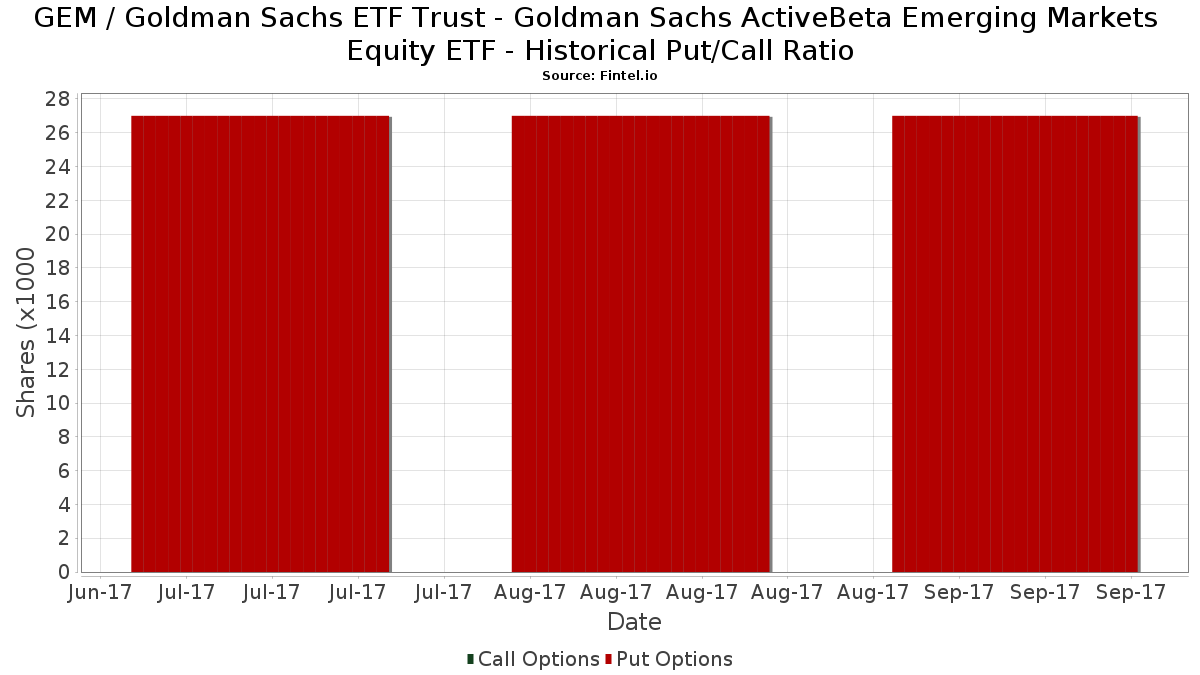
Oltre a segnalare le emissioni standard di titoli azionari e di debito, gli istituti con più di 100 milioni di asset in gestione devono anche dichiarare le loro partecipazioni in opzioni put e call. Poiché le opzioni put indicano generalmente un sentiment negativo e le opzioni call un sentiment positivo, possiamo avere un'idea del sentiment istituzionale complessivo attraverso il rapporto tra put e call. Il grafico a destra mostra il rapporto storico put/call per questo strumento.
L'utilizzo del rapporto put/call come indicatore del sentiment degli investitori consente di superare una delle principali lacune dell'utilizzo della proprietà istituzionale totale, ovvero il fatto che una quantità significativa di asset in gestione viene investita passivamente per seguire gli indici. Generalmente, i fondi a gestione passiva non acquistano opzioni, per cui il rapporto put/call riflette più fedelmente il sentiment dei fondi a gestione attiva.
Depositi 13F e NPORT
Le informazioni relative ai depositi 13F sono gratuite. Per accedere alle informazioni relative ai depositi NP è necessario un'abbonamento premium. Le righe verdi indicano le nuove posizioni. Le righe rosse indicano le posizioni chiuse. Fai clic sull'icona del link per visualizzare la cronologia completa delle transazioni.
Esegui l'upgrade
per sbloccare i dati premium ed esportarli in Excel ![]() .
.
| Data di deposito | Fonte | Investitore | Tipo | Prezzo medio (Stima) |
Azioni | Δ Azioni (%) |
Valore dichiarato ($ 1000) |
Δ Valore (%) |
Allocazione del portafoglio (%) |
|
|---|---|---|---|---|---|---|---|---|---|---|
| 2025-07-28 | 13F | Kiker Wealth Management, LLC | 337 | -27,06 | 13 | -20,00 | ||||
| 2025-08-14 | 13F | Integrated Wealth Concepts LLC | 14.250 | 6,18 | 530 | 19,10 | ||||
| 2025-05-16 | 13F | Coppell Advisory Solutions LLC | 0 | -100,00 | 0 | |||||
| 2025-07-22 | 13F | HFM Investment Advisors, LLC | 189 | 5,59 | 7 | 40,00 | ||||
| 2025-07-07 | 13F | Nova Wealth Management, Inc. | 19 | -92,31 | 1 | -100,00 | ||||
| 2025-08-13 | 13F | Baird Financial Group, Inc. | 40.263 | -1,00 | 1.498 | 11,05 | ||||
| 2025-07-17 | 13F | HB Wealth Management, LLC | 1.124.949 | -36,81 | 41.859 | -29,13 | ||||
| 2025-08-19 | 13F | Anchor Investment Management, LLC | 116.302 | 6,42 | 4.328 | 19,33 | ||||
| 2025-08-14 | 13F | Citadel Advisors Llc | 289.967 | 3.903,41 | 10.790 | 4.395,42 | ||||
| 2025-08-05 | 13F | Key FInancial Inc | 41 | 0,00 | 2 | 0,00 | ||||
| 2025-08-14 | 13F | State Of Wisconsin Investment Board | 1.091.863 | 0,00 | 40.628 | 12,15 | ||||
| 2025-08-12 | 13F | Proequities, Inc. | 0 | 0 | ||||||
| 2025-04-21 | 13F | ORG Partners LLC | 0 | -100,00 | 0 | |||||
| 2025-08-13 | 13F | Maia Wealth LLC | 11.913 | -2,55 | 443 | 13,01 | ||||
| 2025-07-28 | 13F | Elmwood Wealth Management, Inc. | 25.220 | -0,05 | 938 | 12,07 | ||||
| 2025-08-06 | 13F | Golden State Wealth Management, LLC | 34.402 | -8,61 | 1.280 | 2,48 | ||||
| 2025-08-11 | 13F | Wealthspire Advisors, LLC | 8.796 | -23,21 | 327 | -13,95 | ||||
| 2025-08-08 | 13F | Hartland & Co., LLC | 0 | -100,00 | 0 | |||||
| 2025-08-05 | 13F | Bank of New York Mellon Corp | 25.442 | 3,83 | 947 | 16,36 | ||||
| 2025-07-31 | 13F | Cambridge Investment Research Advisors, Inc. | 9.714 | -2,05 | 0 | |||||
| 2025-08-11 | 13F | Principal Securities, Inc. | 318.162 | 33,42 | 11.839 | 55,54 | ||||
| 2025-07-30 | 13F | Whittier Trust Co Of Nevada Inc | 16.910 | -4,69 | 629 | 6,97 | ||||
| 2025-08-04 | 13F | Spinnaker Trust | 204.634 | -4,97 | 7.614 | 6,58 | ||||
| 2025-08-12 | 13F | AlphaCore Capital LLC | 109.617 | 638,01 | 4.079 | 728,86 | ||||
| 2025-08-14 | 13F | Royal Bank Of Canada | 359.226 | 28,25 | 13.366 | 43,83 | ||||
| 2025-08-14 | 13F | Betterment LLC | 2.098.854 | 19,20 | 78 | 34,48 | ||||
| 2025-08-14 | 13F | Bank Of America Corp /de/ | 483.005 | 0,20 | 17.973 | 12,37 | ||||
| 2025-08-13 | 13F | Continuum Advisory, LLC | 0 | -100,00 | 0 | |||||
| 2025-08-14 | 13F | First Foundation Advisors | 330.790 | 2,55 | 12.309 | 15,00 | ||||
| 2025-07-30 | 13F | Whittier Trust Co | 13.527 | -29,87 | 503 | -21,28 | ||||
| 2025-08-06 | 13F | AE Wealth Management LLC | 141 | 69,88 | 5 | 150,00 | ||||
| 2025-07-30 | 13F | Cullen/frost Bankers, Inc. | 557 | 0,00 | 21 | 11,11 | ||||
| 2025-08-14 | 13F | Glenview Trust Co | 8.897 | -1,36 | 331 | 10,70 | ||||
| 2025-08-13 | 13F | Cheviot Value Management, LLC | 65 | 0,00 | 2 | 0,00 | ||||
| 2025-08-14 | 13F | Qube Research & Technologies Ltd | 1.377 | -62,39 | 51 | -57,85 | ||||
| 2025-07-09 | 13F | Pallas Capital Advisors LLC | 0 | -100,00 | 0 | |||||
| 2025-07-25 | 13F | Prostatis Group LLC | 32.539 | 104,63 | 1.211 | 129,60 | ||||
| 2025-08-14 | 13F | Ameriprise Financial Inc | 0 | -100,00 | 0 | |||||
| 2025-08-19 | 13F | Advisory Services Network, LLC | 6.208 | 1,31 | 232 | 14,29 | ||||
| 2025-05-15 | 13F | Stonehaven Wealth & Tax Solutions, Llc | 0 | -100,00 | 0 | |||||
| 2025-08-14 | 13F | Goldman Sachs Group Inc | 2.941.097 | 7,81 | 109.438 | 20,91 | ||||
| 2025-07-18 | 13F | Truist Financial Corp | 23.996 | 8,69 | 893 | 21,86 | ||||
| 2025-08-11 | 13F | Hexagon Capital Partners LLC | 0 | -100,00 | 0 | |||||
| 2025-08-12 | 13F | Clearwater Capital Advisors, LLC | 9.380 | -92,68 | 349 | -91,80 | ||||
| 2025-07-21 | 13F | Quent Capital, LLC | 0 | -100,00 | 0 | |||||
| 2025-08-11 | 13F | Citigroup Inc | 18.096 | 2,68 | 673 | 15,24 | ||||
| 2025-04-09 | 13F | Signature Securities Group Corporation | 0 | -100,00 | 0 | -100,00 | ||||
| 2025-07-11 | 13F/A | Umb Bank N A/mo | 27 | -90,53 | 1 | -88,89 | ||||
| 2025-07-25 | 13F | Envestnet Portfolio Solutions, Inc. | 129.989 | -0,96 | 4.837 | 11,04 | ||||
| 2025-08-14 | 13F | Susquehanna International Group, Llp | 41.614 | -28,87 | 1.548 | -20,25 | ||||
| 2025-07-30 | 13F | D.a. Davidson & Co. | 7.530 | 0,00 | 280 | 12,45 | ||||
| 2025-08-14 | 13F | LifePlan Investment Advisors, Inc. | 21.652 | 39,04 | 806 | 56,01 | ||||
| 2025-08-14 | 13F | Comerica Bank | 10.386 | -13,02 | 386 | -2,53 | ||||
| 2025-07-29 | 13F | Harbor Asset Planning, Inc. | 327 | 12 | ||||||
| 2025-08-14 | 13F | 10Elms LLP | 1 | 0,00 | 0 | |||||
| 2025-08-07 | 13F | CENTRAL TRUST Co | 104.317 | 4,10 | 3.882 | 16,76 | ||||
| 2025-07-17 | 13F | CogentBlue Wealth Advisors, LLC | 7.457 | -2,85 | 277 | 9,06 | ||||
| 2025-07-24 | 13F | Mengis Capital Management, Inc. | 5.935 | 221 | ||||||
| 2025-08-14 | 13F | Fmr Llc | 1.795 | -14,40 | 67 | -4,35 | ||||
| 2025-08-01 | 13F | Strategic Financial Services, Inc, | 245.844 | 13,79 | 9.148 | 27,61 | ||||
| 2025-08-19 | NP | GAPIX - Goldman Sachs Dynamic Global Equity Fund Institutional | 85.902 | 14,84 | 3.196 | 28,82 | ||||
| 2025-08-06 | 13F | Mark Sheptoff Financial Planning, Llc | 29 | 0,00 | 1 | |||||
| 2025-08-19 | NP | GOIIX - Goldman Sachs Growth and Income Strategy Portfolio Institutional | 130.954 | 0,00 | 4.873 | 12,13 | ||||
| 2025-04-29 | 13F | Callan Capital, LLC | 99.619 | -1,11 | 3.305 | 2,80 | ||||
| 2025-08-01 | 13F | Bank of Jackson Hole Trust | 0 | -100,00 | 0 | |||||
| 2025-07-07 | 13F | Investors Research Corp | 523 | 0,00 | 19 | 11,76 | ||||
| 2025-08-15 | 13F | Equitable Holdings, Inc. | 0 | -100,00 | 0 | |||||
| 2025-08-12 | 13F | Jpmorgan Chase & Co | 11.495 | 989,57 | 428 | 1.120,00 | ||||
| 2025-07-08 | 13F | Parallel Advisors, LLC | 74 | -25,25 | 3 | -33,33 | ||||
| 2025-08-14 | 13F | Raymond James Financial Inc | 392.021 | 1,29 | 14.587 | 13,60 | ||||
| 2025-08-04 | 13F | Assetmark, Inc | 11 | 0 | ||||||
| 2025-09-04 | 13F/A | Advisor Group Holdings, Inc. | 28.852 | 13,35 | 1.073 | 27,13 | ||||
| 2025-04-21 | 13F | Nelson, Van Denburg & Campbell Wealth Management Group, LLC | 0 | -100,00 | 0 | |||||
| 2025-08-27 | 13F/A | Brinker Capital Investments, LLC | 11.109 | 4,68 | 413 | 17,33 | ||||
| 2025-08-08 | 13F | Pnc Financial Services Group, Inc. | 359 | 0,00 | 13 | 18,18 | ||||
| 2025-08-05 | 13F | GPS Wealth Strategies Group, LLC | 349 | 12,94 | 13 | 20,00 | ||||
| 2025-08-13 | 13F | GeoWealth Management, LLC | 62.562 | -4,39 | 2.328 | 7,23 | ||||
| 2025-08-07 | 13F | Vise Technologies, Inc. | 0 | -100,00 | 0 | |||||
| 2025-08-04 | 13F | Creative Financial Designs Inc /adv | 331 | 0,00 | 12 | 20,00 | ||||
| 2025-08-12 | 13F | O'shaughnessy Asset Management, Llc | 405 | -29,07 | 15 | -16,67 | ||||
| 2025-07-03 | 13F | Arvest Investments, Inc. | 446.226 | -2,49 | 16.604 | 9,35 | ||||
| 2025-08-19 | 13F | Asset Dedication, LLC | 47 | 2 | ||||||
| 2025-07-07 | 13F | Thurston, Springer, Miller, Herd & Titak, Inc. | 111 | 4 | ||||||
| 2025-07-28 | 13F | Morris Financial Concepts, Inc. | 11.485 | -0,57 | 427 | 11,49 | ||||
| 2025-08-11 | 13F | Shufro Rose & Co Llc | 42.591 | -0,71 | 1.413 | -0,70 | ||||
| 2025-04-14 | 13F | Greenspring Advisors, LLC | 6.641 | 0,00 | 220 | 4,27 | ||||
| 2025-08-13 | 13F | Jones Financial Companies Lllp | 2.293 | -39,48 | 85 | -32,54 | ||||
| 2025-07-21 | 13F | Monticello Wealth Management, Llc | 78.368 | -4,43 | 2.916 | 7,21 | ||||
| 2025-08-14 | 13F | EP Wealth Advisors, Inc. | 22.118 | -0,01 | 823 | 12,28 | ||||
| 2025-08-14 | 13F | Jane Street Group, Llc | 131.318 | 932,62 | 4.886 | 1.060,57 | ||||
| 2025-07-28 | 13F | Naviter Wealth, LLC | 5.813 | 216 | ||||||
| 2025-08-14 | 13F | GWM Advisors LLC | 22.129 | 11,89 | 823 | 25,46 | ||||
| 2025-08-13 | 13F | StoneX Group Inc. | 0 | -100,00 | 0 | -100,00 | ||||
| 2025-08-13 | 13F | Flow Traders U.s. Llc | 26.289 | 1 | ||||||
| 2025-08-11 | 13F | Aptus Capital Advisors, LLC | 683 | 0,00 | 25 | 13,64 | ||||
| 2025-08-12 | 13F | Steward Partners Investment Advisory, Llc | 1.560 | 171,30 | 58 | 205,26 | ||||
| 2025-07-17 | 13F | Archford Capital Strategies, LLC | 8.849 | -1,52 | 329 | 10,40 | ||||
| 2025-08-13 | 13F | EverSource Wealth Advisors, LLC | 416 | 0,00 | 15 | 15,38 | ||||
| 2025-08-11 | 13F | Heritage Wealth Advisors | 200 | 0,00 | 7 | 16,67 | ||||
| 2025-08-14 | 13F | Wiley Bros.-aintree Capital, Llc | 32.018 | -0,44 | 1.188 | 11,04 | ||||
| 2025-08-14 | 13F | Mariner, LLC | 53.758 | 0,08 | 2.000 | 12,23 | ||||
| 2025-07-16 | 13F | Signaturefd, Llc | 40 | 1 | ||||||
| 2025-07-18 | 13F | Consolidated Portfolio Review Corp | 8.101 | 301 | ||||||
| 2025-08-15 | 13F | Morgan Stanley | 706.273 | -2,10 | 26.280 | 9,80 | ||||
| 2025-07-24 | 13F | Capital Advisors, Ltd. LLC | 2.302 | -8,61 | 0 | |||||
| 2025-08-06 | 13F | Rialto Wealth Management, LLC | 439 | 0,00 | 16 | 14,29 | ||||
| 2025-07-30 | 13F | Syntegra Private Wealth Group, LLC | 16.350 | 90,14 | 608 | 113,33 | ||||
| 2025-07-14 | 13F | Golden State Equity Partners | 29.712 | -13,21 | 1.106 | -2,73 | ||||
| 2025-08-08 | 13F | Strategies Wealth Advisors, LLC | 11.997 | 0,00 | 446 | 12,06 | ||||
| 2025-08-08 | 13F | Altfest L J & Co Inc | 12.693 | -38,69 | 472 | -31,20 | ||||
| 2025-08-13 | 13F | Marshall Wace, Llp | 147.817 | 722,39 | 5.500 | 822,82 | ||||
| 2025-05-13 | 13F | Bokf, Na | 0 | -100,00 | 0 | |||||
| 2025-07-24 | 13F | Us Bancorp \de\ | 454 | 123,65 | 17 | 166,67 | ||||
| 2025-07-31 | 13F | Buckingham Strategic Partners | 10.197 | 15,91 | 379 | 30,24 | ||||
| 2025-07-14 | 13F | U.S. Capital Wealth Advisors, LLC | 5.973 | -1,86 | 222 | 10,45 | ||||
| 2025-08-12 | 13F | MAI Capital Management | 700 | 0,00 | 26 | 13,04 | ||||
| 2025-08-14 | 13F | Strategic Wealth Designers | 0 | 0 | ||||||
| 2025-07-21 | NP | GGMBX - Goldman Sachs Global Managed Beta Fund Institutional Shares | 1.537.577 | 16,39 | 53.508 | 24,17 | ||||
| 2025-07-29 | 13F | Kelman-Lazarov, Inc. | 15.178 | -65,11 | 565 | -60,91 | ||||
| 2025-08-11 | 13F | HighTower Advisors, LLC | 9.205 | 0,00 | 343 | 12,13 | ||||
| 2025-08-05 | 13F | Bank Of Montreal /can/ | 992 | 37 | ||||||
| 2025-08-12 | 13F | Gladstone Institutional Advisory LLC | 104.923 | 0,87 | 3.904 | 13,13 | ||||
| 2025-08-13 | 13F | Northwestern Mutual Wealth Management Co | 388 | 11,49 | 14 | 27,27 | ||||
| 2025-08-06 | 13F | Commonwealth Equity Services, Llc | 157.937 | -0,34 | 6 | 0,00 | ||||
| 2025-07-24 | 13F | GFG Capital, LLC | 151.428 | -4,95 | 5.635 | 6,58 | ||||
| 2025-07-14 | 13F | AdvisorNet Financial, Inc | 143 | 0,00 | 5 | 25,00 | ||||
| 2025-07-16 | 13F | RWM Asset Management, LLC | 163.880 | 3,31 | 6.098 | 15,85 | ||||
| 2025-07-16 | 13F | Kathmere Capital Management, LLC | 6.433 | -0,60 | 239 | 11,68 | ||||
| 2025-08-13 | 13F | Congress Wealth Management LLC / DE / | 0 | -100,00 | 0 | |||||
| 2025-08-13 | 13F | Haverford Trust Co | 11.576 | 0,00 | 431 | 11,98 | ||||
| 2025-07-09 | 13F | Breakwater Investment Management | 75 | 0,00 | 3 | 0,00 | ||||
| 2025-08-14 | 13F | Smartleaf Asset Management LLC | 2 | -98,17 | 0 | -100,00 | ||||
| 2025-07-08 | 13F | Atwood & Palmer Inc | 47.310 | -1,57 | 1.760 | 10,41 | ||||
| 2025-08-13 | 13F | IAG Wealth Partners, LLC | 17.127 | 72,86 | 637 | 94,21 | ||||
| 2025-08-14 | 13F | Wells Fargo & Company/mn | 3.522.921 | 7,48 | 131.088 | 20,53 | ||||
| 2025-05-15 | 13F | Tower Research Capital LLC (TRC) | 0 | -100,00 | 0 | |||||
| 2025-07-28 | 13F | Harbour Investments, Inc. | 822 | -9,77 | 31 | 0,00 | ||||
| 2025-08-08 | 13F | Cetera Investment Advisers | 350.522 | 1,35 | 13.043 | 13,66 | ||||
| 2025-07-10 | 13F | Wealth Enhancement Advisory Services, Llc | 65.136 | -36,46 | 2.448 | -28,05 | ||||
| 2025-08-14 | 13F | CoreCap Advisors, LLC | 132.106 | 2,52 | 4.916 | 14,97 | ||||
| 2025-05-07 | 13F | WMS Partners, LLC | 0 | -100,00 | 0 | |||||
| 2025-07-16 | 13F | American National Bank | 126.967 | -5,30 | 4.724 | 6,21 | ||||
| 2025-08-14 | 13F | Old Mission Capital Llc | 49.008 | 1.824 | ||||||
| 2025-07-08 | 13F | Apella Capital, LLC | 338.287 | -15,74 | 12.530 | -0,79 | ||||
| 2025-08-12 | 13F | LPL Financial LLC | 1.918.529 | 5,94 | 71.388 | 18,81 | ||||
| 2025-08-19 | NP | GGSIX - Goldman Sachs Growth Strategy Portfolio Institutional | 197.259 | 0,00 | 7.340 | 12,15 | ||||
| 2025-05-15 | 13F | Chilton Investment Co Llc | 0 | -100,00 | 0 | |||||
| 2025-07-24 | 13F | Edge Financial Advisors LLC | 20.015 | -10,51 | 745 | 0,27 | ||||
| 2025-08-13 | 13F | Brown Advisory Inc | 0 | -100,00 | 0 | |||||
| 2025-08-14 | 13F | UBS Group AG | 258.100 | 4,17 | 9.604 | 16,81 | ||||
| 2025-07-25 | 13F | Cwm, Llc | 186 | -49,87 | 0 | |||||
| 2025-05-09 | 13F | NewEdge Wealth, LLC | 0 | -100,00 | 0 | |||||
| 2025-08-18 | 13F | Geneos Wealth Management Inc. | 290 | 11 | ||||||
| 2025-08-07 | 13F | Allworth Financial LP | 974 | 0,00 | 36 | 12,50 | ||||
| 2025-08-13 | 13F | SageView Advisory Group, LLC | 15.596 | -1,52 | 589 | 12,19 | ||||
| 2025-07-17 | 13F | Independence Bank of Kentucky | 850 | 32 | ||||||
| 2025-08-12 | 13F | Inscription Capital, LLC | 0 | -100,00 | 0 | |||||
| 2025-08-19 | NP | GIPIX - Goldman Sachs Balanced Strategy Portfolio Institutional | 49.119 | 0,00 | 1.828 | 12,15 | ||||
| 2025-07-17 | 13F | Clay Northam Wealth Management, LLC | 53.457 | 0,00 | 1.989 | 12,18 | ||||
| 2025-07-29 | 13F | Private Trust Co Na | 2.149 | 29,61 | 80 | 43,64 | ||||
| 2025-08-01 | 13F | Envestnet Asset Management Inc | 815.464 | 4,70 | 30.343 | 17,42 | ||||
| 2025-07-30 | 13F | Princeton Global Asset Management LLC | 497 | 0,00 | 18 | 12,50 | ||||
| 2025-07-17 | 13F | Worth Financial Advisory Group, LLC | 13.703 | -4,17 | 510 | 7,38 | ||||
| 2025-08-08 | 13F | Arvest Bank Trust Division | 1.212.184 | -0,59 | 45.105 | 11,48 | ||||
| 2025-08-08 | 13F | Larson Financial Group LLC | 0 | -100,00 | 0 | |||||
| 2025-07-25 | 13F | PrairieView Partners, LLC | 104 | 0,00 | 0 | |||||
| 2025-07-30 | 13F | Gables Capital Management Inc. | 4 | 0,00 | 0 | |||||
| 2025-08-11 | 13F | TD Waterhouse Canada Inc. | 1.075 | -20,37 | 40 | -11,11 | ||||
| 2025-07-28 | 13F | Frazier Financial Advisors, LLC | 10 | 0,00 | 0 | |||||
| 2025-07-10 | 13F | Wedmont Private Capital | 8.000 | 0,00 | 298 | 17,32 | ||||
| 2025-05-15 | 13F | Alexis Investment Partners, LLC | 0 | -100,00 | 0 | |||||
| 2025-08-12 | 13F | Global Retirement Partners, LLC | 8.068 | 19,03 | 300 | 38,89 | ||||
| 2025-08-29 | 13F | Centaurus Financial, Inc. | 4.200 | 11,26 | 0 | |||||
| 2025-07-18 | 13F | SigFig Wealth Management, LLC | 3.303.512 | -1,07 | 122.659 | 10,43 | ||||
| 2025-04-21 | 13F | Ronald Blue Trust, Inc. | 0 | -100,00 | 0 | -100,00 | ||||
| 2025-07-22 | 13F | Coastal Investment Advisors, Inc. | 0 | -100,00 | 0 | |||||
| 2025-08-12 | 13F | Change Path, LLC | 11.209 | -2,96 | 417 | 8,88 | ||||
| 2025-07-25 | 13F | Atria Wealth Solutions, Inc. | 13.771 | -55,86 | 512 | -50,53 | ||||
| 2025-08-13 | 13F | Colonial Trust Co / SC | 208 | 0,00 | 8 | 16,67 | ||||
| 2025-05-15 | 13F/A | Orion Portfolio Solutions, LLC | 10.612 | 40,11 | 352 | 46,06 | ||||
| 2025-07-08 | 13F | Nbc Securities, Inc. | 455 | 0,00 | 0 | |||||
| 2025-07-28 | 13F | BRYN MAWR TRUST Co | 4.410 | -9,59 | 164 | 1,86 | ||||
| 2025-08-14 | 13F | Keebeck Wealth Management, LLC | 30.865 | 1.148 | ||||||
| 2025-07-23 | 13F | West Paces Advisors Inc. | 0 | -100,00 | 0 |
Other Listings
| MX:GEM |