Statistiche di base
| Azioni istituzionali (Long) | 2.666.531 - 3,01% (ex 13D/G) - change of 0,01MM shares 0,21% MRQ |
| Valore istituzionale (Long) | $ 3.104 USD ($1000) |
Proprietà istituzionale e azionisti
CBAK Energy Technology, Inc. (US:CBAT) ha 34 proprietari istituzionali e azionisti che hanno presentato i moduli 13D/G o 13F alla Securities Exchange Commission (SEC). Queste istituzioni detengono un totale di 2,666,531 azioni. I maggiori azionisti includono Bridgeway Capital Management Inc, Empowered Funds, LLC, BSVO - EA Bridgeway Omni Small-Cap Value ETF, State Street Corp, BOSVX - Omni Small-Cap Value Fund Class N, SPEM - SPDR(R) Portfolio Emerging Markets ETF, Citadel Advisors Llc, Goldman Sachs Group Inc, FNCMX - Fidelity Nasdaq Composite Index Fund, and Geode Capital Management, Llc .
(CBAK Energy Technology, Inc. (NasdaqCM:CBAT) la struttura proprietaria istituzionale mostra le attuali posizioni nella società da parte di istituzioni e fondi, nonché le ultime variazioni nella dimensione della posizione. I principali azionisti possono essere singoli investitori, fondi comuni, hedge fund o istituzioni. L'allegato 13D indica che l'investitore detiene (o ha detenuto) più del 5% della società e intende (o intendeva) perseguire attivamente un cambiamento nella strategia aziendale. L'allegato 13G indica un investimento passivo superiore al 5%.
The share price as of September 5, 2025 is 0,92 / share. Previously, on September 6, 2024, the share price was 0,98 / share. This represents a decline of 5,82% over that period.

Indice del sentiment dei fondi
L'indice del sentiment dei fondi (anche noto come "indice di accumulo di proprietà") individua i titoli più acquistati dai fondi. È il risultato di un sofisticato modello quantitativo multi-fattore che identifica le società con i più alti livelli di accumulo istituzionale. Il modello utilizza una combinazione dell'aumento totale dei proprietari dichiarati, delle variazioni nelle allocazioni di portafoglio di tali proprietari e di altre metriche. Il punteggio varia da 0 a 100: i numeri più alti indicano un livello di accumulo superiore ad altre società, mentre 50 rappresenta la media.
Frequenza di aggiornamento: giornaliera
Consulta Ownership Explorer per visualizzare l'elenco delle aziende con il ranking più alto.
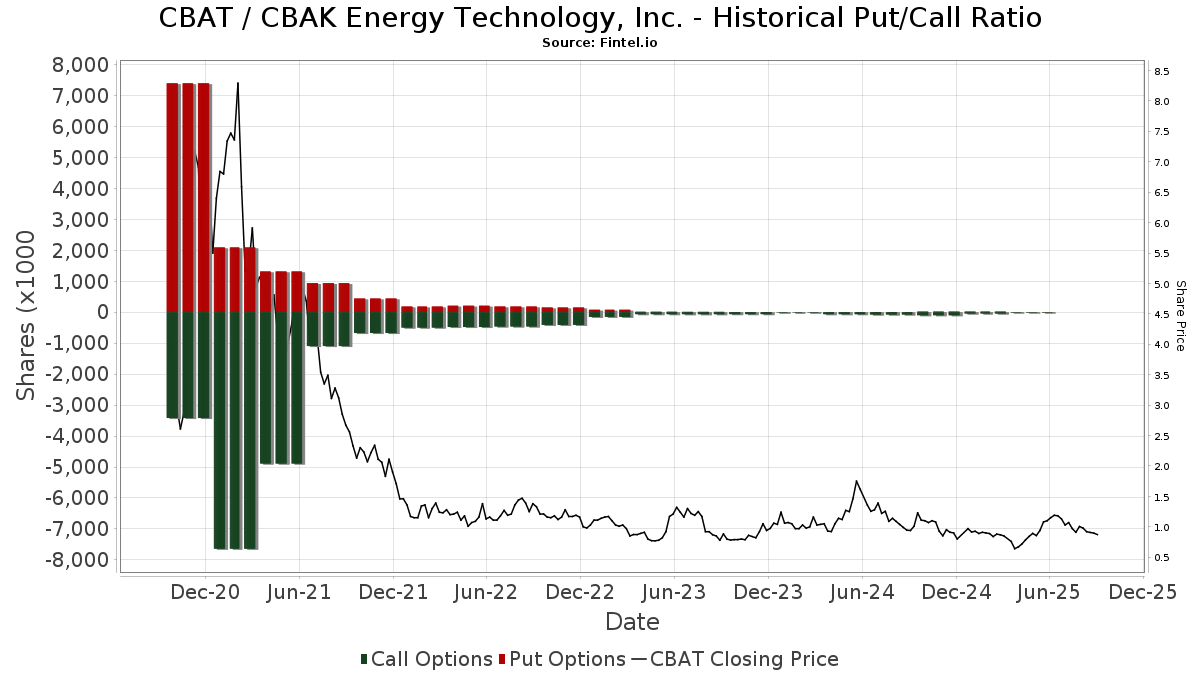
Rapporto put/call istituzionale
Oltre a segnalare le emissioni standard di titoli azionari e di debito, gli istituti con più di 100 milioni di asset in gestione devono anche dichiarare le loro partecipazioni in opzioni put e call. Poiché le opzioni put indicano generalmente un sentiment negativo e le opzioni call un sentiment positivo, possiamo avere un'idea del sentiment istituzionale complessivo attraverso il rapporto tra put e call. Il grafico a destra mostra il rapporto storico put/call per questo strumento.
L'utilizzo del rapporto put/call come indicatore del sentiment degli investitori consente di superare una delle principali lacune dell'utilizzo della proprietà istituzionale totale, ovvero il fatto che una quantità significativa di asset in gestione viene investita passivamente per seguire gli indici. Generalmente, i fondi a gestione passiva non acquistano opzioni, per cui il rapporto put/call riflette più fedelmente il sentiment dei fondi a gestione attiva.
Depositi 13F e NPORT
Le informazioni relative ai depositi 13F sono gratuite. Per accedere alle informazioni relative ai depositi NP è necessario un'abbonamento premium. Le righe verdi indicano le nuove posizioni. Le righe rosse indicano le posizioni chiuse. Fai clic sull'icona del link per visualizzare la cronologia completa delle transazioni.
Esegui l'upgrade
per sbloccare i dati premium ed esportarli in Excel ![]() .
.
| Data di deposito | Fonte | Investitore | Tipo | Prezzo medio (Stima) |
Azioni | Δ Azioni (%) |
Valore dichiarato ($ 1000) |
Δ Valore (%) |
Allocazione del portafoglio (%) |
|
|---|---|---|---|---|---|---|---|---|---|---|
| 2025-08-14 | 13F | Susquehanna International Group, Llp | 29.925 | -67,91 | 35 | -52,70 | ||||
| 2025-08-08 | 13F | Larson Financial Group LLC | 0 | -100,00 | 0 | |||||
| 2025-08-11 | 13F | Empowered Funds, LLC | 389.190 | 9,47 | 459 | 62,19 | ||||
| 2025-08-14 | 13F | Hrt Financial Lp | 14.503 | 0 | ||||||
| 2025-07-24 | NP | FNCMX - Fidelity Nasdaq Composite Index Fund This fund is a listed as child fund of Fmr Llc and if that institution has disclosed ownership in this security, then these positions will not be double counted when calculating total shares and total value | 53.154 | -11,60 | 52 | 6,12 | ||||
| 2025-08-14 | 13F | Ameriprise Financial Inc | 19.999 | 0,00 | 24 | 53,33 | ||||
| 2025-08-13 | 13F | Northwestern Mutual Wealth Management Co | 300 | 0 | ||||||
| 2025-05-15 | 13F | Tower Research Capital LLC (TRC) | 0 | -100,00 | 0 | |||||
| 2025-08-14 | 13F | Susquehanna International Group, Llp | Put | 0 | -100,00 | 0 | ||||
| 2025-08-14 | 13F | Two Sigma Securities, Llc | 0 | -100,00 | 0 | |||||
| 2025-08-14 | 13F | Susquehanna International Group, Llp | Call | 0 | -100,00 | 0 | ||||
| 2025-05-08 | 13F | Us Bancorp \de\ | 0 | -100,00 | 0 | |||||
| 2025-08-26 | NP | BOSVX - Omni Small-Cap Value Fund Class N | 285.000 | -20,83 | 336 | 17,48 | ||||
| 2025-09-04 | 13F/A | Advisor Group Holdings, Inc. | 2.205 | -0,85 | 3 | 100,00 | ||||
| 2025-08-14 | 13F | Citadel Advisors Llc | 84.521 | 100 | ||||||
| 2025-08-29 | NP | BSVO - EA Bridgeway Omni Small-Cap Value ETF | 388.690 | 9,33 | 459 | 61,84 | ||||
| 2025-08-14 | 13F | Goldman Sachs Group Inc | 72.563 | 86 | ||||||
| 2025-08-12 | 13F | Proequities, Inc. | Put | 0 | 0 | |||||
| 2025-08-12 | 13F | Proequities, Inc. | Call | 0 | 0 | |||||
| 2025-05-15 | 13F | Old Mission Capital Llc | 0 | -100,00 | 0 | -100,00 | ||||
| 2025-08-12 | 13F | Proequities, Inc. | 0 | 0 | ||||||
| 2025-08-01 | 13F | James Investment Research Inc | 52.521 | 41,95 | 62 | 110,34 | ||||
| 2025-08-15 | 13F | Morgan Stanley | 14.514 | -12,11 | 17 | 30,77 | ||||
| 2025-08-19 | 13F | National Asset Management, Inc. | 12.200 | 0,00 | 14 | 27,27 | ||||
| 2025-08-28 | NP | EWX - SPDR(R) S&P(R) EMERGING MARKETS SMALL CAP ETF | 13.718 | 0,00 | 16 | 60,00 | ||||
| 2025-04-02 | 13F | Global Wealth Strategies & Associates | 0 | -100,00 | 0 | |||||
| 2025-07-31 | 13F | Azzad Asset Management Inc /adv | 24.312 | 0,00 | 29 | 47,37 | ||||
| 2025-08-05 | 13F | Simplex Trading, Llc | Put | 100 | 0 | |||||
| 2025-08-05 | 13F | Simplex Trading, Llc | 2.144 | -72,59 | 0 | |||||
| 2025-08-05 | 13F | Simplex Trading, Llc | Call | 900 | -66,67 | 0 | ||||
| 2025-08-28 | NP | SPEM - SPDR(R) Portfolio Emerging Markets ETF | 238.396 | 10,40 | 281 | 63,37 | ||||
| 2025-05-08 | 13F | Gsa Capital Partners Llp | 0 | -100,00 | 0 | |||||
| 2025-08-14 | 13F | Royal Bank Of Canada | 0 | -100,00 | 0 | |||||
| 2025-08-14 | 13F | Bridgeway Capital Management Inc | 674.190 | -5,78 | 796 | 39,47 | ||||
| 2025-08-14 | 13F | State Street Corp | 294.088 | 6,90 | 347 | 58,45 | ||||
| 2025-08-08 | 13F | Geode Capital Management, Llc | 53.154 | -11,60 | 63 | 31,91 | ||||
| 2025-08-12 | 13F | Virtu Financial LLC | 0 | -100,00 | 0 | |||||
| 2025-08-13 | 13F | BCJ Capital Management, LLC | 14.964 | 0,00 | 18 | 54,55 | ||||
| 2025-07-21 | 13F | Empirical Financial Services, LLC d.b.a. Empirical Wealth Management | 10.250 | 0,00 | 12 | 50,00 | ||||
| 2025-07-23 | 13F | Sachetta, LLC | 10 | 0,00 | 0 | |||||
| 2025-08-28 | NP | GXC - SPDR(R) S&P(R) CHINA ETF | 40.812 | -10,17 | 48 | 33,33 | ||||
| 2025-05-15 | 13F | Marshall Wace, Llp | 0 | -100,00 | 0 | -100,00 | ||||
| 2025-08-11 | 13F | Citigroup Inc | 2.843 | 3 | ||||||
| 2025-08-14 | 13F | Bank Of America Corp /de/ | 900 | 0,00 | 1 | |||||
| 2025-08-14 | 13F | GWM Advisors LLC | 52.521 | 41,95 | 62 | 110,34 | ||||
| 2025-08-14 | 13F | UBS Group AG | 48.448 | -3,31 | 57 | 46,15 | ||||
| 2025-08-14 | 13F | Group One Trading, L.p. | Call | 11.400 | 20,00 | 13 | 85,71 | |||
| 2025-08-14 | 13F | Ancora Advisors, LLC | 760 | 1 | ||||||
| 2025-08-12 | 13F | Jpmorgan Chase & Co | 1.113 | 1 | ||||||
| 2025-08-14 | 13F | Group One Trading, L.p. | 26.342 | 0,00 | 31 | 55,00 | ||||
| 2025-04-22 | 13F | Atticus Wealth Management, Llc | 0 | -100,00 | 0 | |||||
| 2025-08-08 | 13F | SBI Securities Co., Ltd. | 6.861 | 0,00 | 8 | 60,00 | ||||
| 2025-08-12 | 13F | XTX Topco Ltd | 34.346 | 0,67 | 41 | 48,15 | ||||
| 2025-08-14 | 13F | Group One Trading, L.p. | Put | 7.800 | 0,00 | 9 | 50,00 |