Statistiche di base
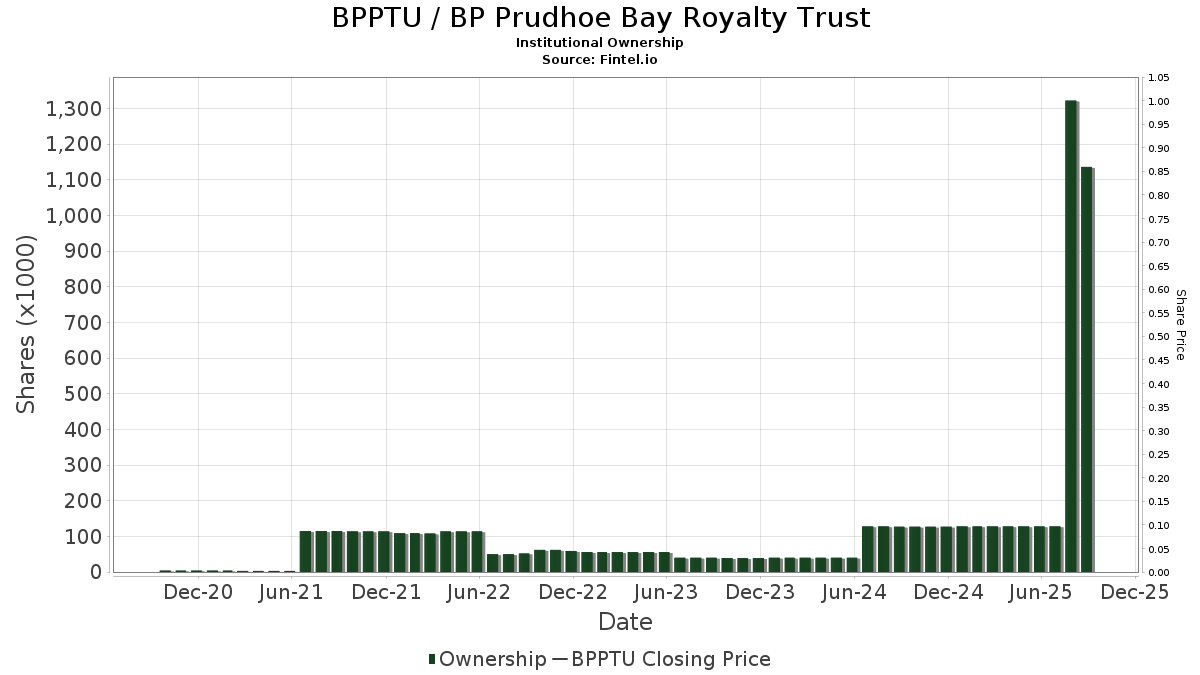
| Azioni istituzionali (Long) | 1.136.474 (ex 13D/G) - change of -0,17MM shares -12,88% MRQ |
| Valore istituzionale (Long) | $ 510 USD ($1000) |
Proprietà istituzionale e azionisti
BP Prudhoe Bay Royalty Trust (US:BPPTU) ha 43 proprietari istituzionali e azionisti che hanno presentato i moduli 13D/G o 13F alla Securities Exchange Commission (SEC). Queste istituzioni detengono un totale di 1,136,474 azioni. I maggiori azionisti includono Ashton Thomas Private Wealth, LLC, Citadel Advisors Llc, PRFZ - Invesco FTSE RAFI US 1500 Small-Mid ETF, Two Sigma Investments, Lp, Wedbush Securities Inc, Susquehanna International Group, Llp, Welch Group, LLC, XTX Topco Ltd, UBS Group AG, and Morgan Stanley .
(BP Prudhoe Bay Royalty Trust (OTCPK:BPPTU) la struttura proprietaria istituzionale mostra le attuali posizioni nella società da parte di istituzioni e fondi, nonché le ultime variazioni nella dimensione della posizione. I principali azionisti possono essere singoli investitori, fondi comuni, hedge fund o istituzioni. L'allegato 13D indica che l'investitore detiene (o ha detenuto) più del 5% della società e intende (o intendeva) perseguire attivamente un cambiamento nella strategia aziendale. L'allegato 13G indica un investimento passivo superiore al 5%.
Indice del sentiment dei fondi
L'indice del sentiment dei fondi (anche noto come "indice di accumulo di proprietà") individua i titoli più acquistati dai fondi. È il risultato di un sofisticato modello quantitativo multi-fattore che identifica le società con i più alti livelli di accumulo istituzionale. Il modello utilizza una combinazione dell'aumento totale dei proprietari dichiarati, delle variazioni nelle allocazioni di portafoglio di tali proprietari e di altre metriche. Il punteggio varia da 0 a 100: i numeri più alti indicano un livello di accumulo superiore ad altre società, mentre 50 rappresenta la media.
Frequenza di aggiornamento: giornaliera
Consulta Ownership Explorer per visualizzare l'elenco delle aziende con il ranking più alto.
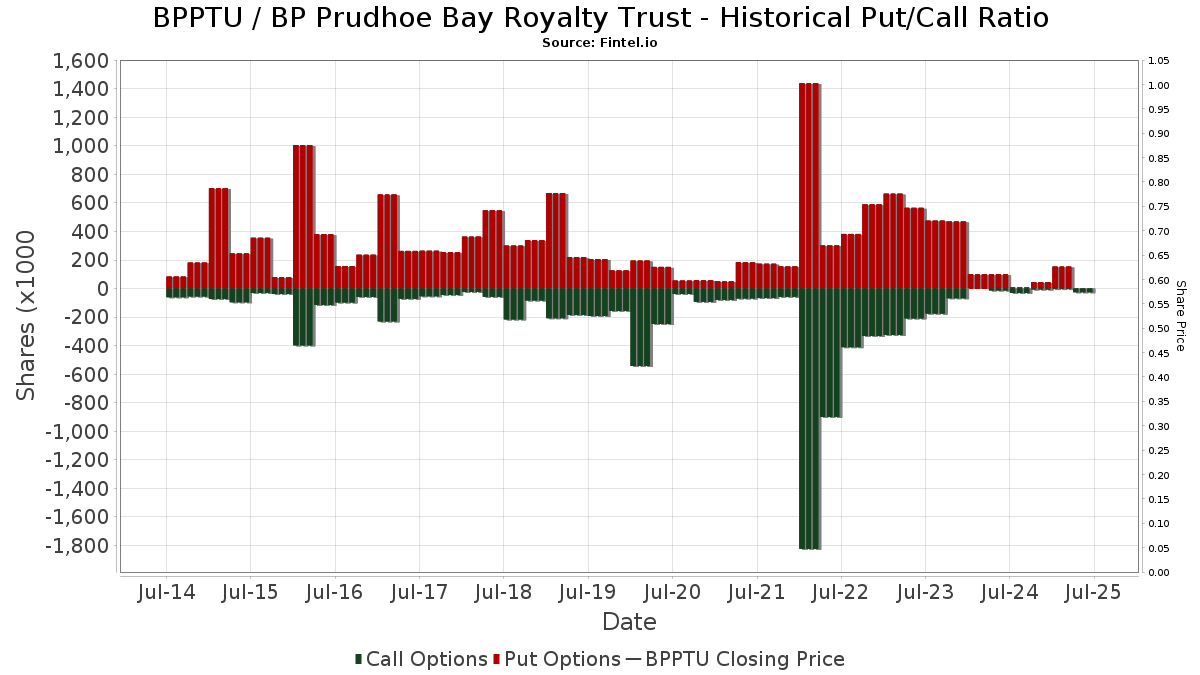
Rapporto put/call istituzionale
Oltre a segnalare le emissioni standard di titoli azionari e di debito, gli istituti con più di 100 milioni di asset in gestione devono anche dichiarare le loro partecipazioni in opzioni put e call. Poiché le opzioni put indicano generalmente un sentiment negativo e le opzioni call un sentiment positivo, possiamo avere un'idea del sentiment istituzionale complessivo attraverso il rapporto tra put e call. Il grafico a destra mostra il rapporto storico put/call per questo strumento.
L'utilizzo del rapporto put/call come indicatore del sentiment degli investitori consente di superare una delle principali lacune dell'utilizzo della proprietà istituzionale totale, ovvero il fatto che una quantità significativa di asset in gestione viene investita passivamente per seguire gli indici. Generalmente, i fondi a gestione passiva non acquistano opzioni, per cui il rapporto put/call riflette più fedelmente il sentiment dei fondi a gestione attiva.
Depositi 13F e NPORT
Le informazioni relative ai depositi 13F sono gratuite. Per accedere alle informazioni relative ai depositi NP è necessario un'abbonamento premium. Le righe verdi indicano le nuove posizioni. Le righe rosse indicano le posizioni chiuse. Fai clic sull'icona del link per visualizzare la cronologia completa delle transazioni.
Esegui l'upgrade
per sbloccare i dati premium ed esportarli in Excel ![]() .
.
| Data di deposito | Fonte | Investitore | Tipo | Prezzo medio (Stima) |
Azioni | Δ Azioni (%) |
Valore dichiarato ($ 1000) |
Δ Valore (%) |
Allocazione del portafoglio (%) |
|
|---|---|---|---|---|---|---|---|---|---|---|
| 2025-08-14 | 13F | Two Sigma Investments, Lp | 77.912 | -22,47 | 39 | -29,09 | ||||
| 2025-08-12 | 13F | PSI Advisors, LLC | 0 | -100,00 | 0 | |||||
| 2025-05-12 | 13F | Invesco Ltd. | 0 | -100,00 | 0 | |||||
| 2025-05-07 | 13F | Sheaff Brock Investment Advisors, LLC | 16.963 | 0,00 | 9 | 12,50 | ||||
| 2025-08-12 | 13F | Virtu Financial LLC | 23.244 | 41,85 | 0 | |||||
| 2025-04-30 | 13F | Sofos Investments, Inc. | 0 | -100,00 | 0 | -100,00 | ||||
| 2025-08-06 | 13F | Wedbush Securities Inc | 47.263 | -0,53 | 0 | |||||
| 2025-08-14 | 13F | Jane Street Group, Llc | 0 | -100,00 | 0 | |||||
| 2025-08-14 | 13F | Royal Bank Of Canada | 733 | -78,75 | 0 | -100,00 | ||||
| 2025-08-14 | 13F | Hunting Hill Global Capital, LLC | 0 | -100,00 | 0 | |||||
| 2025-07-25 | 13F | Welch Group, LLC | 33.759 | 0,00 | 17 | -11,11 | ||||
| 2025-07-21 | 13F | DHJJ Financial Advisors, Ltd. | 25 | 0,00 | 0 | |||||
| 2025-07-10 | 13F | Baader Bank INC | 0 | -100,00 | 0 | |||||
| 2025-08-05 | 13F | Carolinas Wealth Consulting Llc | 0 | -100,00 | 0 | |||||
| 2025-08-13 | 13F | Alerus Financial Na | 3.850 | 2 | ||||||
| 2025-08-14 | 13F | Group One Trading, L.p. | 4.953 | -61,62 | 2 | -71,43 | ||||
| 2025-08-14 | 13F | Wells Fargo & Company/mn | 853 | -56,32 | 0 | -100,00 | ||||
| 2025-08-15 | 13F | Fidelity D & D Bancorp Inc | 21.000 | 0,00 | 11 | -9,09 | ||||
| 2025-08-14 | 13F | Goldman Sachs Group Inc | 0 | -100,00 | 0 | |||||
| 2025-08-14 | 13F | Citadel Advisors Llc | Put | 0 | -100,00 | 0 | ||||
| 2025-08-13 | 13F | StoneX Group Inc. | 0 | -100,00 | 0 | -100,00 | ||||
| 2025-08-14 | 13F | Safeguard Investment Advisory Group, LLC | 15.607 | 0,00 | 8 | -12,50 | ||||
| 2025-05-13 | 13F | Steward Partners Investment Advisory, Llc | 0 | -100,00 | 0 | |||||
| 2025-08-14 | 13F | Fmr Llc | 1.000 | 1 | ||||||
| 2025-08-12 | 13F | CIBC Private Wealth Group, LLC | 0 | -100,00 | 0 | |||||
| 2025-08-14 | 13F | UBS Group AG | 29.509 | -64,67 | 15 | -69,57 | ||||
| 2025-05-15 | 13F | Creative Planning | 0 | -100,00 | 0 | |||||
| 2025-08-14 | 13F | Two Sigma Securities, Llc | 0 | -100,00 | 0 | |||||
| 2025-08-14 | 13F | SIH Partners, LLLP | Put | 0 | -100,00 | 0 | ||||
| 2025-05-16 | 13F | Coppell Advisory Solutions LLC | 0 | -100,00 | 0 | |||||
| 2025-08-14 | 13F | Federation des caisses Desjardins du Quebec | 0 | -100,00 | 0 | |||||
| 2025-08-14 | 13F/A | Barclays Plc | 23 | 0,00 | 0 | |||||
| 2025-07-16 | 13F | Signaturefd, Llc | 47 | 0,00 | 0 | |||||
| 2025-08-04 | 13F | Creekmur Asset Management LLC | 0 | -100,00 | 0 | |||||
| 2025-09-04 | 13F/A | Advisor Group Holdings, Inc. | 10.927 | 3,05 | 5 | 0,00 | ||||
| 2025-08-14 | 13F | Hrt Financial Lp | 16.510 | 0 | ||||||
| 2025-07-31 | 13F | Azzad Asset Management Inc /adv | 22.000 | 0,00 | 11 | -8,33 | ||||
| 2025-08-01 | 13F | Ashton Thomas Private Wealth, LLC | 429.752 | 0,00 | 216 | -9,28 | ||||
| 2025-07-15 | 13F | FLP Wealth Management, LLC | 0 | -100,00 | 0 | |||||
| 2025-08-05 | 13F | Simplex Trading, Llc | 2.213 | -80,98 | 0 | |||||
| 2025-08-12 | 13F | XTX Topco Ltd | 31.569 | -45,53 | 16 | -53,12 | ||||
| 2025-08-15 | 13F | Morgan Stanley | 28.637 | -9,38 | 14 | -17,65 | ||||
| 2025-05-15 | 13F | Gts Securities Llc | 0 | -100,00 | 0 | |||||
| 2025-08-11 | 13F | Private Advisor Group, LLC | 11.510 | 0,00 | 6 | -16,67 | ||||
| 2025-04-01 | NP | PRFZ - Invesco FTSE RAFI US 1500 Small-Mid ETF This fund is a listed as child fund of Invesco Ltd. and if that institution has disclosed ownership in this security, then these positions will not be double counted when calculating total shares and total value | 128.441 | -0,13 | 67 | -49,62 | ||||
| 2025-08-14 | 13F | Bank Of America Corp /de/ | 4.901 | 0,82 | 2 | 0,00 | ||||
| 2025-07-15 | 13F | Mather Group, Llc. | 0 | -100,00 | 0 | |||||
| 2025-08-12 | 13F | Bokf, Na | 64 | -82,42 | 0 | |||||
| 2025-04-24 | 13F | Trust Co Of Vermont | 0 | -100,00 | 0 | |||||
| 2025-07-23 | 13F | Narwhal Capital Management | 23.587 | 0,00 | 12 | -15,38 | ||||
| 2025-08-14 | 13F | Gould Capital, LLC | 70 | 0,00 | 0 | |||||
| 2025-08-12 | 13F | Proequities, Inc. | 0 | 0 | ||||||
| 2025-07-11 | 13F | Adirondack Trust Co | 100 | 0,00 | 0 | |||||
| 2025-05-07 | 13F | Vista Private Wealth Partners. LLC | 0 | -100,00 | 0 | |||||
| 2025-08-07 | 13F | Allworth Financial LP | 17.178 | 6.969,14 | 9 | |||||
| 2025-08-11 | 13F | Bellwether Advisors, LLC | 1 | 0,00 | 0 | |||||
| 2025-08-14 | 13F | GWM Advisors LLC | 894 | 0,00 | 0 | |||||
| 2025-05-02 | 13F | Whittier Trust Co Of Nevada Inc | 0 | -100,00 | 0 | |||||
| 2025-07-15 | 13F | Cranbrook Wealth Management, LLC | 676 | 0,00 | 0 | |||||
| 2025-08-08 | 13F | Cetera Investment Advisers | 13.827 | -6,27 | 7 | -25,00 | ||||
| 2025-08-13 | 13F | Northern Trust Corp | 0 | -100,00 | 0 | |||||
| 2025-08-14 | 13F | Citadel Advisors Llc | Call | 25.300 | 583,78 | 13 | 500,00 | |||
| 2025-07-24 | 13F | Us Bancorp \de\ | 900 | 0,00 | 0 | |||||
| 2025-08-14 | 13F | Citadel Advisors Llc | 202.731 | 4,50 | 102 | -5,61 | ||||
| 2025-08-12 | 13F | MAI Capital Management | 2.320 | 0,00 | 1 | 0,00 | ||||
| 2025-08-14 | 13F | Susquehanna International Group, Llp | 36.800 | -18,83 | 18 | -28,00 | ||||
| 2025-08-14 | 13F | Raymond James Financial Inc | 1.420 | 1 | ||||||
| 2025-05-16 | 13F | Jones Financial Companies Lllp | 0 | -100,00 | 0 | |||||
| 2025-07-21 | 13F | Ameritas Advisory Services, LLC | 1.000 | 1 | ||||||
| 2025-08-19 | 13F | Cape Investment Advisory, Inc. | 16 | 0,00 | 0 | |||||
| 2025-08-14 | 13F | Sunbelt Securities, Inc. | 130 | 0,00 | 0 |