Statistiche di base
| Proprietari istituzionali | 157 total, 152 long only, 0 short only, 5 long/short - change of -5,42% MRQ |
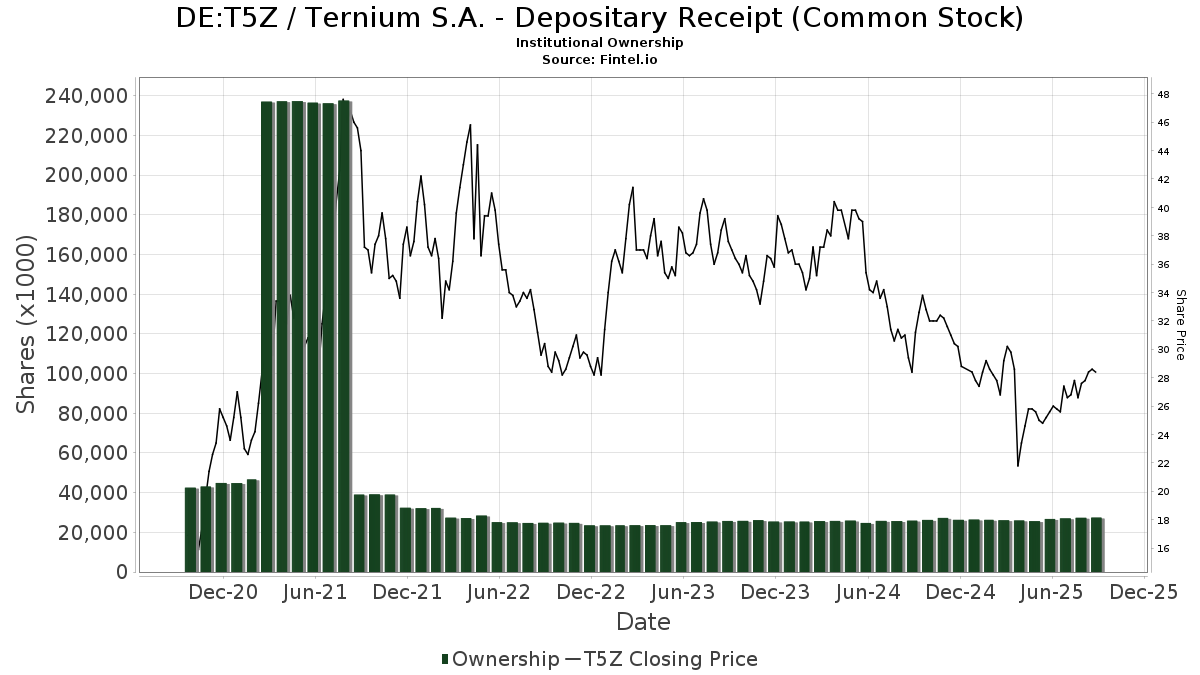
| Prezzo dell'azione | 28,80 |
| Allocazione media del portafoglio | 0.3250 % - change of 1,24% MRQ |
| Azioni istituzionali (Long) | 27.418.114 (ex 13D/G) - change of 0,69MM shares 2,57% MRQ |
| Valore istituzionale (Long) | $ 628.276 USD ($1000) |
Proprietà istituzionale e azionisti
Ternium S.A. - Depositary Receipt (Common Stock) (DE:T5Z) ha 157 proprietari istituzionali e azionisti che hanno presentato i moduli 13D/G o 13F alla Securities Exchange Commission (SEC). Queste istituzioni detengono un totale di 27,418,114 azioni. I maggiori azionisti includono Lazard Asset Management Llc, Donald Smith & Co., Inc., Ninety One UK Ltd, Schroder Investment Management Group, VASVX - Vanguard Selected Value Fund Investor Shares, Ninety One North America, Inc., Acadian Asset Management Llc, Contrarian Capital Management, L.l.c., LZOEX - Lazard Emerging Markets Equity Portfolio Open Shares, and Oaktree Capital Management Lp .
(Ternium S.A. - Depositary Receipt (Common Stock) (DB:T5Z) la struttura proprietaria istituzionale mostra le attuali posizioni nella società da parte di istituzioni e fondi, nonché le ultime variazioni nella dimensione della posizione. I principali azionisti possono essere singoli investitori, fondi comuni, hedge fund o istituzioni. L'allegato 13D indica che l'investitore detiene (o ha detenuto) più del 5% della società e intende (o intendeva) perseguire attivamente un cambiamento nella strategia aziendale. L'allegato 13G indica un investimento passivo superiore al 5%.
The share price as of September 5, 2025 is 28,80 / share. Previously, on September 6, 2024, the share price was 29,20 / share. This represents a decline of 1,37% over that period.
Indice del sentiment dei fondi
L'indice del sentiment dei fondi (anche noto come "indice di accumulo di proprietà") individua i titoli più acquistati dai fondi. È il risultato di un sofisticato modello quantitativo multi-fattore che identifica le società con i più alti livelli di accumulo istituzionale. Il modello utilizza una combinazione dell'aumento totale dei proprietari dichiarati, delle variazioni nelle allocazioni di portafoglio di tali proprietari e di altre metriche. Il punteggio varia da 0 a 100: i numeri più alti indicano un livello di accumulo superiore ad altre società, mentre 50 rappresenta la media.
Frequenza di aggiornamento: giornaliera
Consulta Ownership Explorer per visualizzare l'elenco delle aziende con il ranking più alto.
Depositi 13F e NPORT
Le informazioni relative ai depositi 13F sono gratuite. Per accedere alle informazioni relative ai depositi NP è necessario un'abbonamento premium. Le righe verdi indicano le nuove posizioni. Le righe rosse indicano le posizioni chiuse. Fai clic sull'icona del link per visualizzare la cronologia completa delle transazioni.
Esegui l'upgrade
per sbloccare i dati premium ed esportarli in Excel ![]() .
.
| Data di deposito | Fonte | Investitore | Tipo | Prezzo medio (Stima) |
Azioni | Δ Azioni (%) |
Valore dichiarato ($ 1000) |
Δ Valore (%) |
Allocazione del portafoglio (%) |
|
|---|---|---|---|---|---|---|---|---|---|---|
| 2025-07-21 | 13F | Qrg Capital Management, Inc. | 0 | -100,00 | 0 | |||||
| 2025-07-31 | 13F | State of New Jersey Common Pension Fund D | 92.528 | 0,00 | 2.785 | -3,40 | ||||
| 2025-07-30 | NP | IPAV - Global X Infrastructure Development ex-U.S. ETF | 259 | 62,89 | 7 | 75,00 | ||||
| 2025-03-27 | NP | HERIX - Hartford Emerging Markets Equity Fund Class I | 14.841 | 0,00 | 445 | -12,06 | ||||
| 2025-07-24 | 13F | Ronald Blue Trust, Inc. | 1.912 | -10,74 | 58 | -13,64 | ||||
| 2025-08-14 | 13F | Deprince Race & Zollo Inc | 139.739 | 4.206 | ||||||
| 2025-08-05 | 13F | Key FInancial Inc | 600 | 0,00 | 18 | 0,00 | ||||
| 2025-08-13 | 13F | Northern Trust Corp | 0 | -100,00 | 0 | |||||
| 2025-08-11 | 13F | Bell Investment Advisors, Inc | 52 | -53,57 | 2 | -66,67 | ||||
| 2025-08-12 | 13F | Edmond De Rothschild Holding S.a. | 900 | 0,00 | 27 | -3,57 | ||||
| 2025-05-15 | 13F | Woodline Partners LP | 0 | -100,00 | 0 | |||||
| 2025-08-19 | 13F | State of Wyoming | 3.954 | 119 | ||||||
| 2025-07-30 | NP | AUERX - Auer Growth Fund | 18.000 | 0,00 | 493 | -5,38 | ||||
| 2025-08-04 | 13F | Hantz Financial Services, Inc. | 6.998 | 1.360,96 | 0 | |||||
| 2025-08-14 | 13F | Two Sigma Advisers, Lp | 0 | -100,00 | 0 | |||||
| 2025-06-18 | NP | RMYAX - Multi-Strategy Income Fund Class A | 1.540 | 0,00 | 44 | -4,35 | ||||
| 2025-08-25 | NP | PRINCIPAL VARIABLE CONTRACTS FUNDS INC - International Emerging Markets Account Class 1 | 2.835 | 35,65 | 85 | 30,77 | ||||
| 2025-08-14 | 13F | Vident Advisory, LLC | 13.899 | 13,22 | 418 | 9,42 | ||||
| 2025-08-14 | 13F | Canada Pension Plan Investment Board | 120.249 | 0,00 | 3.619 | -3,39 | ||||
| 2025-05-09 | 13F | Commonwealth Equity Services, Llc | 0 | -100,00 | 0 | |||||
| 2025-08-06 | 13F | Savant Capital, LLC | 0 | -100,00 | 0 | |||||
| 2025-08-08 | 13F | Geode Capital Management, Llc | 0 | -100,00 | 0 | |||||
| 2025-05-12 | 13F | FIL Ltd | 0 | -100,00 | 0 | -100,00 | ||||
| 2025-06-18 | NP | REMSX - Emerging Markets Fund Class S | 24.795 | 0,00 | 716 | -3,77 | ||||
| 2025-08-14 | 13F | Citadel Advisors Llc | Call | 30.800 | 124,82 | 927 | 117,61 | |||
| 2025-08-13 | 13F | Towle & Co | 24.794 | 4,69 | 746 | 1,22 | ||||
| 2025-08-13 | 13F | Northwestern Mutual Wealth Management Co | 393 | 12 | ||||||
| 2025-03-31 | NP | FZILX - Fidelity ZERO International Index Fund This fund is a listed as child fund of Fmr Llc and if that institution has disclosed ownership in this security, then these positions will not be double counted when calculating total shares and total value | 6.978 | 0,00 | 209 | -12,18 | ||||
| 2025-06-23 | NP | PEAPX - International Emerging Markets Fund R-3 | 83.046 | 0,00 | 2.397 | -3,81 | ||||
| 2025-08-07 | 13F | Dalton Investments LLC | 23.584 | 0,00 | 710 | -3,41 | ||||
| 2025-07-07 | 13F | Thurston, Springer, Miller, Herd & Titak, Inc. | 118 | 0,00 | 4 | 0,00 | ||||
| 2025-08-07 | 13F | Campbell & CO Investment Adviser LLC | 9.515 | -50,25 | 286 | -51,93 | ||||
| 2025-08-12 | 13F | Cornerstone Select Advisors, LLC | 0 | -100,00 | 0 | |||||
| 2025-08-08 | 13F | Cetera Investment Advisers | 9.358 | -3,24 | 282 | -6,64 | ||||
| 2025-08-08 | 13F | SBI Securities Co., Ltd. | 3.567 | 8,35 | 107 | 4,90 | ||||
| 2025-07-08 | 13F | Northwest & Ethical Investments L.P. | 0 | -100,00 | 0 | -100,00 | ||||
| 2025-07-31 | 13F | MQS Management LLC | 0 | -100,00 | 0 | |||||
| 2025-08-27 | 13F/A | Squarepoint Ops LLC | 0 | -100,00 | 0 | -100,00 | ||||
| 2025-07-18 | 13F | Robeco Institutional Asset Management B.V. | 403.293 | 5,22 | 12.139 | 1,64 | ||||
| 2025-07-28 | NP | IUS - Invesco RAFI(TM) Strategic US ETF This fund is a listed as child fund of Invesco Ltd. and if that institution has disclosed ownership in this security, then these positions will not be double counted when calculating total shares and total value | 14.053 | 0,60 | 385 | -4,71 | ||||
| 2025-08-13 | 13F | WealthTrust Axiom LLC | 22.350 | -5,50 | 673 | -8,70 | ||||
| 2025-03-31 | NP | APITX - Yorktown Growth Fund Class L Shares | 8.275 | 0,00 | 248 | -12,06 | ||||
| 2025-08-12 | 13F | XTX Topco Ltd | 0 | -100,00 | 0 | |||||
| 2025-08-13 | 13F | Russell Investments Group, Ltd. | 576.869 | -14,34 | 17.455 | -16,78 | ||||
| 2025-08-14 | 13F | Aquatic Capital Management LLC | 29.675 | 246,55 | 893 | 235,71 | ||||
| 2025-05-15 | 13F | PointState Capital LP | 0 | -100,00 | 0 | |||||
| 2025-08-12 | 13F | Legal & General Group Plc | 475 | 0,00 | 14 | 0,00 | ||||
| 2025-08-12 | 13F | BlackRock, Inc. | 502.446 | 5,36 | 15.124 | 1,78 | ||||
| 2025-08-13 | 13F | Natixis | 227 | 0,00 | 7 | -14,29 | ||||
| 2025-03-20 | NP | GSEQX - Goldman Sachs Multi-Manager Global Equity Fund Class R6 Shares | 2.982 | 0,00 | 89 | -11,88 | ||||
| 2025-08-11 | 13F | Empirical Finance, LLC | 61.431 | 1.849 | ||||||
| 2025-08-11 | 13F | Cape Ann Asset Management Ltd | 897.049 | -0,69 | 27.001 | -4,06 | ||||
| 2025-04-24 | 13F | Allspring Global Investments Holdings, LLC | 0 | -100,00 | 0 | -100,00 | ||||
| 2025-08-06 | 13F | Oldfield Partners LLP | 138.602 | -21,26 | 4.172 | -23,96 | ||||
| 2025-08-13 | 13F | Oaktree Capital Management Lp | 919.709 | 13,18 | 27.683 | 9,33 | ||||
| 2025-08-27 | NP | SMCF - Themes US Small Cap Cash Flow Champions ETF | 643 | -11,19 | 19 | -13,64 | ||||
| 2025-07-30 | NP | FSAMX - Strategic Advisers Emerging Markets Fund This fund is a listed as child fund of Fmr Llc and if that institution has disclosed ownership in this security, then these positions will not be double counted when calculating total shares and total value | 50.330 | -21,69 | 1.378 | -25,75 | ||||
| 2025-08-14 | 13F | UBS Group AG | 50.618 | 152,18 | 1.524 | 143,68 | ||||
| 2025-08-14 | 13F | Citadel Advisors Llc | Put | 0 | -100,00 | 0 | ||||
| 2025-09-04 | 13F/A | Advisor Group Holdings, Inc. | 3.988 | -4,04 | 120 | -6,98 | ||||
| 2025-08-12 | 13F | LPL Financial LLC | 21.073 | -27,86 | 634 | -30,33 | ||||
| 2025-05-15 | 13F | D. E. Shaw & Co., Inc. | Put | 0 | -100,00 | 0 | -100,00 | |||
| 2025-05-15 | 13F | D. E. Shaw & Co., Inc. | Call | 0 | -100,00 | 0 | -100,00 | |||
| 2025-07-24 | 13F | Standard Life Aberdeen plc | 8.570 | 258 | ||||||
| 2025-07-18 | 13F | Ninety One North America, Inc. | 1.023.049 | 23,43 | 30.794 | 19,23 | ||||
| 2025-08-12 | 13F | Coldstream Capital Management Inc | 0 | -100,00 | 0 | |||||
| 2025-08-18 | 13F/A | National Bank Of Canada /fi/ | 4 | 0,00 | 0 | |||||
| 2025-08-14 | 13F | Van Eck Associates Corp | 105.266 | -1,13 | 3 | 0,00 | ||||
| 2025-08-04 | 13F | Yorktown Management & Research Co Inc | 0 | -100,00 | 0 | |||||
| 2025-07-18 | 13F | Ninety One UK Ltd | 2.407.110 | 5,18 | 72.454 | 1,60 | ||||
| 2025-08-13 | 13F | Donald Smith & Co., Inc. | 3.412.385 | 10,08 | 102.713 | 6,34 | ||||
| 2025-06-26 | NP | HFSSX - Hartford Schroders International Contrarian Value Fund Class SDR | 50.949 | 50,31 | 1.470 | 44,69 | ||||
| 2025-08-13 | 13F/A | StoneX Group Inc. | 5.039 | -0,87 | 230 | 4,07 | ||||
| 2025-08-14 | 13F | MIRAE ASSET GLOBAL ETFS HOLDINGS Ltd. | 453 | 184,91 | 14 | 225,00 | ||||
| 2025-07-25 | 13F | Atria Wealth Solutions, Inc. | 7.000 | 0,00 | 221 | 0,92 | ||||
| 2025-06-25 | NP | CCNR - ALPS | CoreCommodity Natural Resources ETF | 24.628 | 711 | ||||||
| 2025-08-13 | 13F | Kilter Group LLC | 39 | 1 | ||||||
| 2025-08-12 | 13F | Proequities, Inc. | Put | 0 | 0 | |||||
| 2025-08-12 | 13F | Proequities, Inc. | Call | 0 | 0 | |||||
| 2025-08-12 | 13F | Proequities, Inc. | 0 | 0 | ||||||
| 2025-08-14 | 13F | Lazard Asset Management Llc | 5.358.772 | 4,64 | 161 | 1,26 | ||||
| 2025-08-15 | 13F | Caxton Associates Llp | 17.819 | 2,79 | 536 | -0,74 | ||||
| 2025-08-14 | 13F | Fmr Llc | 176 | -57,07 | 5 | -58,33 | ||||
| 2025-08-14 | 13F | Royal Bank Of Canada | 26.106 | -3,19 | 786 | -6,43 | ||||
| 2025-08-15 | 13F | Tower Research Capital LLC (TRC) | 171 | 5.600,00 | 5 | |||||
| 2025-08-13 | 13F | Mackenzie Financial Corp | 120.229 | 63,51 | 3.619 | 57,92 | ||||
| 2025-07-28 | NP | ZEMRX - American Beacon Ninety One Emerging Markets Equity Fund R6 Class | 87.070 | -0,57 | 2.384 | -5,77 | ||||
| 2025-08-14 | 13F | Wells Fargo & Company/mn | 75.781 | -0,98 | 2.281 | -4,32 | ||||
| 2025-08-12 | 13F | Eisler Capital Management Ltd. | 19.018 | 574 | ||||||
| 2025-05-15 | 13F | Balyasny Asset Management Llc | 0 | -100,00 | 0 | -100,00 | ||||
| 2025-06-26 | NP | Mexico Fund Inc | 120.000 | 0,00 | 3.463 | -3,81 | ||||
| 2025-06-26 | NP | AEMGX - Acadian Emerging Markets Portfolio Investor Class Shares | 54.891 | -13,64 | 1.584 | -16,89 | ||||
| 2025-08-21 | NP | LAZARD RETIREMENT SERIES INC - Lazard Retirement Emerging Markets Equity Portfolio Service Shares | 77.454 | -1,88 | 2.331 | -5,21 | ||||
| 2025-08-12 | 13F/A | Boston Partners | 20.994 | 0,00 | 632 | -3,52 | ||||
| 2025-05-06 | 13F | Bank Julius Baer & Co. Ltd, Zurich | 0 | -100,00 | 0 | |||||
| 2025-08-14 | 13F | State Street Corp | 405.144 | 42,93 | 12.195 | 38,07 | ||||
| 2025-08-11 | 13F | Principal Securities, Inc. | 0 | -100,00 | 0 | |||||
| 2025-08-14 | 13F | Raymond James Financial Inc | 7.097 | 214 | ||||||
| 2025-08-13 | 13F | Pictet Asset Management Holding SA | 0 | -100,00 | 0 | |||||
| 2025-08-07 | 13F | Allworth Financial LP | 4 | 0 | ||||||
| 2025-08-08 | 13F | Larson Financial Group LLC | 9 | -82,35 | 0 | -100,00 | ||||
| 2025-08-12 | 13F | Rhumbline Advisers | 1.354 | 0,00 | 41 | -4,76 | ||||
| 2025-06-27 | NP | EAEMX - Parametric Emerging Markets Fund Investor Class | 3.000 | 0,00 | 87 | -4,44 | ||||
| 2025-05-15 | 13F | Ancora Advisors, LLC | 0 | -100,00 | 0 | -100,00 | ||||
| 2025-08-05 | 13F | Simplex Trading, Llc | Call | 3.900 | -79,79 | 0 | ||||
| 2025-08-13 | 13F | Victory Capital Management Inc | 45.584 | 0,00 | 1.372 | -3,38 | ||||
| 2025-08-13 | 13F | EverSource Wealth Advisors, LLC | 485 | 135,44 | 15 | 133,33 | ||||
| 2025-08-14 | 13F | Headlands Technologies LLC | 685 | 591,92 | 21 | 566,67 | ||||
| 2025-08-07 | 13F | Acadian Asset Management Llc | 1.014.799 | -18,03 | 31 | -21,05 | ||||
| 2025-05-14 | 13F | Group One Trading, L.p. | 0 | -100,00 | 0 | -100,00 | ||||
| 2025-06-18 | NP | RAZAX - Multi-Asset Growth Strategy Fund Class A | 4.404 | 0,00 | 127 | -3,79 | ||||
| 2025-07-14 | 13F | GAMMA Investing LLC | 758 | -60,38 | 23 | -62,71 | ||||
| 2025-08-11 | 13F | Empowered Funds, LLC | 61.431 | 1.849 | ||||||
| 2025-08-14 | 13F | Bank Of America Corp /de/ | 32.635 | -35,90 | 982 | -38,08 | ||||
| 2025-08-18 | 13F | Rexford Capital Inc | 4.020 | 121 | ||||||
| 2025-03-31 | NP | ZEMIX - Ninety One Emerging Markets Equity Fund I Shares | 87.570 | -2,41 | 2.627 | -14,15 | ||||
| 2025-08-15 | 13F/A | Symphony Financial, Ltd. Co. | 12.258 | 393 | ||||||
| 2025-05-12 | 13F | Simplex Trading, Llc | 0 | -100,00 | 0 | |||||
| 2025-08-26 | NP | EQ ADVISORS TRUST - EQ/Lazard Emerging Markets Equity Portfolio Class IB | 114.290 | -1,51 | 3.440 | -4,84 | ||||
| 2025-05-15 | 13F | Qube Research & Technologies Ltd | 0 | -100,00 | 0 | |||||
| 2025-08-05 | 13F | Huntington National Bank | 106 | -6,19 | 3 | 0,00 | ||||
| 2025-07-11 | 13F | Arrow Investment Advisors, LLC | 7.345 | 221 | ||||||
| 2025-08-13 | 13F | Oaktree Fund Advisors, LLC | 51.529 | 3,41 | 1.551 | -0,06 | ||||
| 2025-05-27 | NP | VARIABLE INSURANCE PRODUCTS FUND II - International Index Portfolio Initial Class | 1.033 | 7,94 | 32 | 18,52 | ||||
| 2025-08-07 | 13F | Bearing Point Capital, Llc | 17.000 | 7,59 | 512 | 3,86 | ||||
| 2025-08-25 | NP | EITEX - Parametric Tax-Managed Emerging Markets Fund Institutional Class | 7.422 | 0,00 | 223 | -3,46 | ||||
| 2025-08-14 | 13F | Group One Trading, L.p. | Put | 600 | -60,00 | 18 | -60,87 | |||
| 2025-08-14 | 13F | Group One Trading, L.p. | Call | 500 | -93,75 | 15 | -93,98 | |||
| 2025-08-20 | NP | REMG - Emerging Markets Equity Active ETF | 1.610 | 48 | ||||||
| 2025-07-07 | 13F | Investors Research Corp | 17.300 | 166,15 | 521 | 157,43 | ||||
| 2025-08-14 | 13F | Silvercrest Asset Management Group Llc | 52.752 | 51,88 | 1.588 | 46,67 | ||||
| 2025-07-28 | NP | TEMUX - Emerging Markets Equity Fund | 21.284 | 0,48 | 583 | -4,75 | ||||
| 2025-07-17 | 13F | Sound Income Strategies, LLC | 840 | 0,00 | 25 | -3,85 | ||||
| 2025-08-13 | 13F | Amundi | 509.268 | 3,92 | 16.312 | 12,10 | ||||
| 2025-06-26 | NP | DVYE - iShares Emerging Markets Dividend ETF | 223.443 | 6.449 | ||||||
| 2025-08-08 | 13F | Banco Bilbao Vizcaya Argentaria, S.a. | 8.571 | 0,00 | 258 | -3,75 | ||||
| 2025-07-28 | 13F | Allianz Asset Management GmbH | 35.292 | -4,64 | 1.062 | -7,97 | ||||
| 2025-05-15 | 13F | Macquarie Group Ltd | 0 | -100,00 | 0 | |||||
| 2025-08-14 | 13F | Goldman Sachs Group Inc | 50.763 | 9,35 | 1.528 | 5,60 | ||||
| 2025-08-11 | 13F | Citigroup Inc | 3.574 | -63,85 | 108 | -65,26 | ||||
| 2025-07-25 | NP | USEMX - Emerging Markets Fund Shares | 45.797 | 5,79 | 1.254 | 0,24 | ||||
| 2025-08-05 | 13F | Simplex Trading, Llc | Put | 1.300 | 62,50 | 0 | ||||
| 2025-08-14 | 13F | Wellington Management Group Llp | 0 | -100,00 | 0 | |||||
| 2025-03-27 | NP | EQIAX - Wells Fargo Emerging Markets Equity Income Fund Class A | 55.128 | -3,77 | 1.654 | -15,40 | ||||
| 2025-08-14 | 13F | Militia Capital Partners, LP | 36.084 | 16,09 | 1.086 | 12,19 | ||||
| 2025-08-12 | 13F | Jpmorgan Chase & Co | 518 | -0,19 | 16 | -6,25 | ||||
| 2025-08-21 | NP | LZOEX - Lazard Emerging Markets Equity Portfolio Open Shares | 939.276 | 6,80 | 28.272 | 3,17 | ||||
| 2025-08-11 | 13F | TD Waterhouse Canada Inc. | 0 | -100,00 | 0 | |||||
| 2025-08-15 | 13F | Morgan Stanley | 208.382 | -10,58 | 6.272 | -13,62 | ||||
| 2025-08-14 | 13F/A | Skopos Labs, Inc. | 10.036 | 397,32 | 302 | 387,10 | ||||
| 2025-08-14 | 13F | Ubs Asset Management Americas Inc | 0 | -100,00 | 0 | |||||
| 2025-08-13 | 13F | Jones Financial Companies Lllp | 338 | 9,74 | 10 | 11,11 | ||||
| 2025-07-11 | 13F | Farther Finance Advisors, LLC | 42 | -77,54 | 1 | -80,00 | ||||
| 2025-07-15 | 13F | Public Employees Retirement System Of Ohio | 99.868 | -15,19 | 3.006 | -18,07 | ||||
| 2025-08-28 | NP | XCNY - SPDR S&P Emerging Markets ex-China ETF | 100 | 0,00 | 3 | 0,00 | ||||
| 2025-08-14 | 13F/A | Barclays Plc | 1 | -99,98 | 0 | |||||
| 2025-08-13 | 13F | Walleye Trading LLC | Call | 7.500 | 0,00 | 226 | -3,43 | |||
| 2025-08-21 | NP | SLX - VanEck Vectors Steel ETF | 105.266 | -1,13 | 3.169 | -4,49 | ||||
| 2025-08-08 | 13F | Mitsubishi UFJ Trust & Banking Corp | 4.945 | -32,38 | 149 | -34,80 | ||||
| 2025-08-13 | 13F | Walleye Trading LLC | Put | 100 | -80,00 | 3 | -80,00 | |||
| 2025-08-12 | 13F | Advisors Asset Management, Inc. | 0 | -100,00 | 0 | |||||
| 2025-08-13 | 13F | Employees Retirement System of Texas | 6.823 | -56,79 | 0 | |||||
| 2025-07-29 | 13F | Activest Wealth Management | 315 | 6,06 | 9 | 0,00 | ||||
| 2025-08-28 | NP | NDOW - Anydrus Advantage ETF | 2.976 | 90 | ||||||
| 2025-08-08 | 13F | Pnc Financial Services Group, Inc. | 10 | -80,00 | 0 | -100,00 | ||||
| 2025-08-12 | 13F | Prudential Plc | 680.185 | -9,73 | 20.474 | -12,80 | ||||
| 2025-08-14 | 13F | Verition Fund Management LLC | 0 | -100,00 | 0 | |||||
| 2025-08-13 | 13F | Arrowstreet Capital, Limited Partnership | 0 | -100,00 | 0 | |||||
| 2025-08-08 | 13F | Principal Financial Group Inc | 129.297 | 35,41 | 3.892 | 30,79 | ||||
| 2025-08-27 | NP | TPDAX - Timothy Plan Defensive Strategies Fund Class A | 1.095 | 0,00 | 33 | -5,88 | ||||
| 2025-05-02 | 13F | Concord Wealth Partners | 0 | -100,00 | 0 | |||||
| 2025-08-14 | 13F | Jane Street Group, Llc | Call | 11.100 | 334 | |||||
| 2025-08-14 | 13F | Jane Street Group, Llc | Put | 17.800 | 536 | |||||
| 2025-08-15 | 13F | WealthCollab, LLC | 178 | 0,00 | 5 | 0,00 | ||||
| 2025-08-14 | 13F | CoreCommodity Management, LLC | 35.444 | -1,30 | 1.067 | -4,74 | ||||
| 2025-08-14 | 13F | GWM Advisors LLC | 1.200 | 0,00 | 36 | -2,70 | ||||
| 2025-07-30 | 13F | Whittier Trust Co | 180 | 5 | ||||||
| 2025-08-14 | 13F | Millennium Management Llc | 38.975 | -69,27 | 1.173 | -70,31 | ||||
| 2025-03-27 | NP | RTNAX - Tax-Managed International Equity Fund Class A | 41.955 | 0,00 | 1.259 | -12,09 | ||||
| 2025-08-12 | 13F | O'shaughnessy Asset Management, Llc | 13.058 | -8,98 | 393 | -12,08 | ||||
| 2025-07-29 | NP | BPLSX - Boston Partners Long/Short Equity Fund INSTITUTIONAL | 10.217 | 4,31 | 280 | -1,06 | ||||
| 2025-08-06 | 13F | First Horizon Advisors, Inc. | 24 | 1 | ||||||
| 2025-08-26 | NP | OEQAX - Oaktree Emerging Markets Equity Fund Class A | 51.529 | 3,41 | 1.551 | -0,06 | ||||
| 2025-08-12 | 13F | Atlas Capital Advisors Llc | 1.195 | 0,00 | 36 | -5,41 | ||||
| 2025-08-14 | 13F | Susquehanna International Group, Llp | Call | 30.900 | 930 | |||||
| 2025-08-14 | 13F | Susquehanna International Group, Llp | Put | 10.800 | -83,31 | 325 | -83,88 | |||
| 2025-07-15 | 13F | Mather Group, Llc. | 0 | -100,00 | 0 | |||||
| 2025-08-13 | 13F | Renaissance Technologies Llc | 247.900 | -2,56 | 7.462 | -5,88 | ||||
| 2025-07-24 | 13F | Us Bancorp \de\ | 0 | -100,00 | 0 | |||||
| 2025-08-13 | 13F | Jump Financial, LLC | 0 | -100,00 | 0 | |||||
| 2025-06-30 | NP | VASVX - Vanguard Selected Value Fund Investor Shares | 1.180.696 | 0,00 | 34.075 | -3,80 | ||||
| 2025-05-09 | 13F | R Squared Ltd | 0 | -100,00 | 0 | |||||
| 2025-08-14 | 13F | Wiley Bros.-aintree Capital, Llc | 9.325 | 282 | ||||||
| 2025-07-08 | 13F | Lingohr & Partner Asset Management GmbH | 0 | -100,00 | 0 | |||||
| 2025-06-26 | NP | GYLD - Arrow Dow Jones Global Yield ETF | 5.123 | 148 | ||||||
| 2025-08-13 | 13F | Schroder Investment Management Group | 2.177.525 | 11,03 | 65.544 | 7,25 | ||||
| 2025-08-14 | 13F | Sei Investments Co | 25.884 | -46,93 | 779 | -48,72 | ||||
| 2025-08-14 | 13F | Voloridge Investment Management, Llc | 49.856 | -15,30 | 1.501 | -18,21 | ||||
| 2025-05-05 | 13F | Eagle Bay Advisors LLC | 0 | -100,00 | 0 | -100,00 | ||||
| 2025-06-26 | NP | MSTFX - Morningstar International Equity Fund | 17.336 | 15,91 | 500 | 11,61 | ||||
| 2025-08-13 | 13F | Contrarian Capital Management, L.l.c. | 992.413 | 0,00 | 29.872 | -3,40 | ||||
| 2025-08-14 | 13F | Susquehanna International Group, Llp | 0 | -100,00 | 0 | |||||
| 2025-08-14 | 13F | Numerai GP LLC | 11.471 | -11,87 | 345 | -14,81 | ||||
| 2025-08-28 | NP | EDIV - SPDR(R) S&P(R) Emerging Markets Dividend ETF | 260.444 | 17,66 | 7.839 | 13,66 | ||||
| 2025-08-01 | 13F | Envestnet Asset Management Inc | 34.780 | -8,29 | 1.047 | -11,43 | ||||
| 2025-08-14 | 13F | CoreCap Advisors, LLC | 77 | 0,00 | 2 | 0,00 | ||||
| 2025-08-13 | 13F | Invesco Ltd. | 22.257 | 58,38 | 670 | 53,09 | ||||
| 2025-07-30 | NP | ORR - Militia Long/Short Equity ETF | 58.221 | 1.594 |