Statistiche di base
| Proprietari istituzionali | 37 total, 35 long only, 0 short only, 2 long/short - change of 0,00% MRQ |
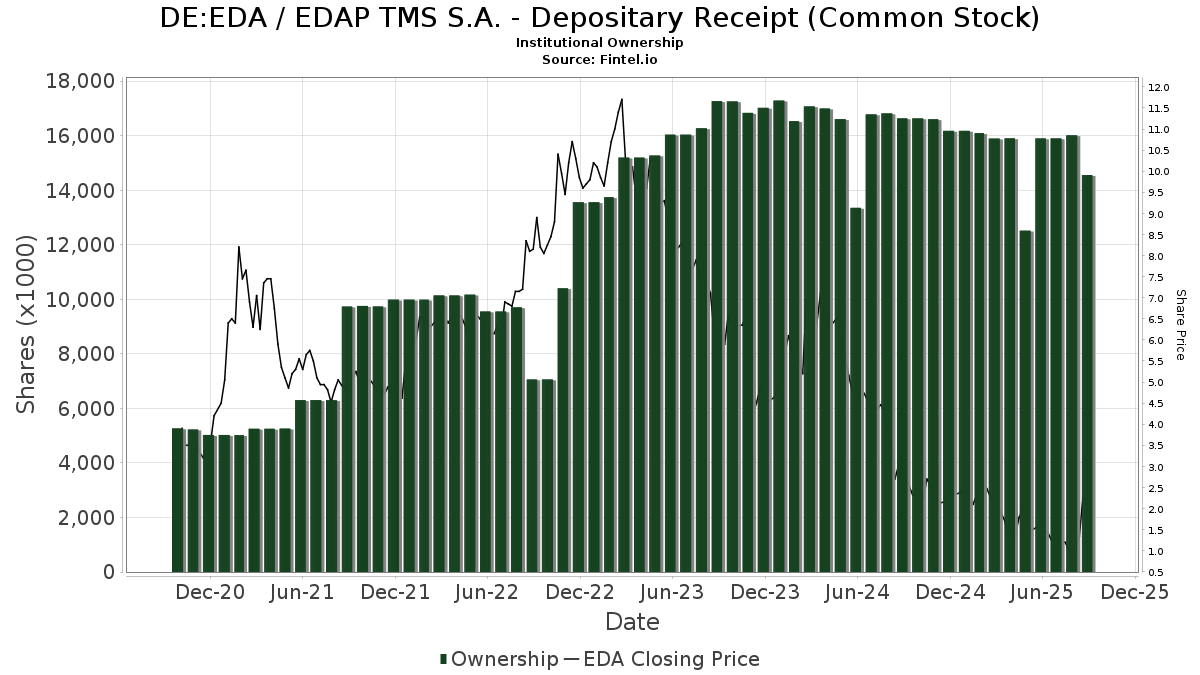
| Prezzo dell'azione | 2,12 |
| Allocazione media del portafoglio | 0.0418 % - change of -45,72% MRQ |
| Azioni istituzionali (Long) | 14.558.307 (ex 13D/G) - change of -1,34MM shares -8,44% MRQ |
| Valore istituzionale (Long) | $ 23.835 USD ($1000) |
Proprietà istituzionale e azionisti
EDAP TMS S.A. - Depositary Receipt (Common Stock) (DE:EDA) ha 37 proprietari istituzionali e azionisti che hanno presentato i moduli 13D/G o 13F alla Securities Exchange Commission (SEC). Queste istituzioni detengono un totale di 14,558,307 azioni. I maggiori azionisti includono Soleus Capital Management, L.P., Morgan Stanley, Rock Springs Capital Management LP, Bruce & Co., Inc., BRUFX - Bruce Fund, Apis Capital Advisors, LLC, UBS Group AG, Schonfeld Strategic Advisors LLC, Parkman Healthcare Partners LLC, and Cahill Financial Advisors Inc .
(EDAP TMS S.A. - Depositary Receipt (Common Stock) (DB:EDA) la struttura proprietaria istituzionale mostra le attuali posizioni nella società da parte di istituzioni e fondi, nonché le ultime variazioni nella dimensione della posizione. I principali azionisti possono essere singoli investitori, fondi comuni, hedge fund o istituzioni. L'allegato 13D indica che l'investitore detiene (o ha detenuto) più del 5% della società e intende (o intendeva) perseguire attivamente un cambiamento nella strategia aziendale. L'allegato 13G indica un investimento passivo superiore al 5%.
The share price as of September 5, 2025 is 2,12 / share. Previously, on September 9, 2024, the share price was 2,72 / share. This represents a decline of 22,06% over that period.
Indice del sentiment dei fondi
L'indice del sentiment dei fondi (anche noto come "indice di accumulo di proprietà") individua i titoli più acquistati dai fondi. È il risultato di un sofisticato modello quantitativo multi-fattore che identifica le società con i più alti livelli di accumulo istituzionale. Il modello utilizza una combinazione dell'aumento totale dei proprietari dichiarati, delle variazioni nelle allocazioni di portafoglio di tali proprietari e di altre metriche. Il punteggio varia da 0 a 100: i numeri più alti indicano un livello di accumulo superiore ad altre società, mentre 50 rappresenta la media.
Frequenza di aggiornamento: giornaliera
Consulta Ownership Explorer per visualizzare l'elenco delle aziende con il ranking più alto.
Depositi 13F e NPORT
Le informazioni relative ai depositi 13F sono gratuite. Per accedere alle informazioni relative ai depositi NP è necessario un'abbonamento premium. Le righe verdi indicano le nuove posizioni. Le righe rosse indicano le posizioni chiuse. Fai clic sull'icona del link per visualizzare la cronologia completa delle transazioni.
Esegui l'upgrade
per sbloccare i dati premium ed esportarli in Excel ![]() .
.
| Data di deposito | Fonte | Investitore | Tipo | Prezzo medio (Stima) |
Azioni | Δ Azioni (%) |
Valore dichiarato ($ 1000) |
Δ Valore (%) |
Allocazione del portafoglio (%) |
|
|---|---|---|---|---|---|---|---|---|---|---|
| 2025-08-14 | 13F | Banque Transatlantique SA | 10.200 | -98,60 | 17 | -98,79 | ||||
| 2025-07-22 | 13F | Valley National Advisers Inc | 3.800 | 0,00 | 0 | |||||
| 2025-08-15 | 13F | Soleus Capital Management, L.P. | 7.309.254 | 0,00 | 12.060 | -15,82 | ||||
| 2025-08-13 | 13F | EverSource Wealth Advisors, LLC | 1.035 | 2 | ||||||
| 2025-05-02 | 13F | Whittier Trust Co Of Nevada Inc | 0 | -100,00 | 0 | |||||
| 2025-08-12 | 13F | Rhumbline Advisers | 2.888 | -11,90 | 5 | -33,33 | ||||
| 2025-08-14 | 13F | Bnp Paribas Arbitrage, Sa | 26.105 | -35,55 | 43 | -45,57 | ||||
| 2025-07-01 | 13F | Harbor Investment Advisory, Llc | 500 | 0,00 | 1 | |||||
| 2025-07-24 | NP | FNCMX - Fidelity Nasdaq Composite Index Fund This fund is a listed as child fund of Fmr Llc and if that institution has disclosed ownership in this security, then these positions will not be double counted when calculating total shares and total value | 22.764 | 0,00 | 41 | -29,82 | ||||
| 2025-08-13 | 13F | Archon Capital Management LLC | 0 | -100,00 | 0 | |||||
| 2025-05-15 | 13F | Tower Research Capital LLC (TRC) | 0 | -100,00 | 0 | |||||
| 2025-08-13 | 13F | Apis Capital Advisors, LLC | 226.288 | -56,82 | 373 | -63,68 | ||||
| 2025-08-12 | 13F | Virtu Financial LLC | 11.914 | 0 | ||||||
| 2025-08-14 | 13F | Summit Trail Advisors, Llc | 102.339 | 169 | ||||||
| 2025-08-14 | 13F | Schonfeld Strategic Advisors LLC | 172.136 | 3,43 | 284 | -12,88 | ||||
| 2025-08-14 | 13F | Intrepid Family Office Llc | 25.000 | 0,00 | 41 | -16,33 | ||||
| 2025-08-14 | 13F | Hrt Financial Lp | 0 | -100,00 | 0 | |||||
| 2025-08-08 | 13F | Accredited Investors Inc. | 21.431 | 0,00 | 35 | -16,67 | ||||
| 2025-04-17 | 13F | FNY Investment Advisers, LLC | Call | 0 | -100,00 | 0 | ||||
| 2025-05-19 | 13F/A | Jane Street Group, Llc | 0 | -100,00 | 0 | -100,00 | ||||
| 2025-07-22 | 13F | Miracle Mile Advisors, LLC | 13.500 | 0,00 | 22 | -15,38 | ||||
| 2025-08-14 | 13F | Millennium Management Llc | 0 | -100,00 | 0 | |||||
| 2025-08-14 | 13F | Scoggin Management Lp | 0 | -100,00 | 0 | |||||
| 2025-07-22 | 13F | Simplicity Wealth,LLC | 32.548 | 54 | ||||||
| 2025-07-31 | 13F | Sage Mountain Advisors LLC | 100.000 | 165 | ||||||
| 2025-08-06 | 13F | Commonwealth Equity Services, Llc | 69.160 | 0,00 | 0 | |||||
| 2025-08-12 | 13F | Proequities, Inc. | Put | 0 | 0 | |||||
| 2025-08-12 | 13F | Proequities, Inc. | Call | 0 | 0 | |||||
| 2025-04-15 | 13F | Redhawk Wealth Advisors, Inc. | 0 | -100,00 | 0 | |||||
| 2025-08-12 | 13F | Proequities, Inc. | 0 | 0 | ||||||
| 2025-08-08 | 13F | Cetera Investment Advisers | 75.000 | 0,00 | 124 | -16,33 | ||||
| 2025-09-04 | 13F/A | Advisor Group Holdings, Inc. | 1.000 | 0,00 | 2 | 0,00 | ||||
| 2025-08-14 | 13F | Parkman Healthcare Partners LLC | 154.832 | 0,00 | 255 | -15,84 | ||||
| 2025-08-29 | NP | BRUFX - Bruce Fund | 529.794 | 0,00 | 869 | -16,38 | ||||
| 2025-05-12 | 13F | Jpmorgan Chase & Co | 0 | -100,00 | 0 | -100,00 | ||||
| 2025-08-14 | 13F | Bruce & Co., Inc. | 553.652 | 0,00 | 908 | -16,41 | ||||
| 2025-07-28 | 13F | Harbour Investments, Inc. | 50 | 0,00 | 0 | |||||
| 2025-08-14 | 13F | Wells Fargo & Company/mn | 3.500 | 0,00 | 6 | -16,67 | ||||
| 2025-08-14 | 13F | BCS Private Wealth Management, Inc. | 13.000 | 0 | ||||||
| 2025-08-14 | 13F | Rock Springs Capital Management LP | 1.270.000 | 0,00 | 2.096 | -15,83 | ||||
| 2025-08-12 | 13F | CIBC Private Wealth Group, LLC | 10.000 | 0,00 | 16 | 14,29 | ||||
| 2025-07-31 | 13F | Orion Capital Management LLC | 38.000 | 0,00 | 63 | -16,22 | ||||
| 2025-08-08 | 13F | Geode Capital Management, Llc | 22.764 | 0,00 | 37 | -15,91 | ||||
| 2025-05-15 | 13F | Bank Of America Corp /de/ | 0 | -100,00 | 0 | |||||
| 2025-08-12 | 13F | BlackRock, Inc. | 844 | 0,00 | 1 | 0,00 | ||||
| 2025-08-15 | 13F | Morgan Stanley | 3.364.580 | -0,03 | 5.552 | -15,84 | ||||
| 2025-08-11 | 13F | Citigroup Inc | 5.548 | 9 | ||||||
| 2025-08-14 | 13F | Group One Trading, L.p. | Call | 9.900 | 241,38 | 16 | 220,00 | |||
| 2025-08-14 | 13F | Susquehanna International Group, Llp | Put | 0 | -100,00 | 0 | ||||
| 2025-08-14 | 13F | Group One Trading, L.p. | Put | 1.200 | 0,00 | 2 | -50,00 | |||
| 2025-08-14 | 13F | Citadel Advisors Llc | 50.621 | -41,22 | 83 | -50,60 | ||||
| 2025-08-14 | 13F | Citadel Advisors Llc | Put | 23.400 | 14,71 | 38 | -2,56 | |||
| 2025-08-14 | 13F | Group One Trading, L.p. | 851 | 0,00 | 1 | 0,00 | ||||
| 2025-08-14 | 13F | Citadel Advisors Llc | Call | 87.900 | 138,86 | 144 | 100,00 | |||
| 2025-08-07 | 13F | Cahill Financial Advisors Inc | 134.960 | 0,00 | 223 | -15,91 | ||||
| 2025-08-07 | 13F | Illumine Investment Management, LLC | 0 | -100,00 | 0 | |||||
| 2025-08-14 | 13F | UBS Group AG | 178.449 | 364,00 | 294 | 292,00 |
Other Listings
| US:EDAP | 2,53 USD |