Statistiche di base
| Profilo insider | WEBER ALAN W |
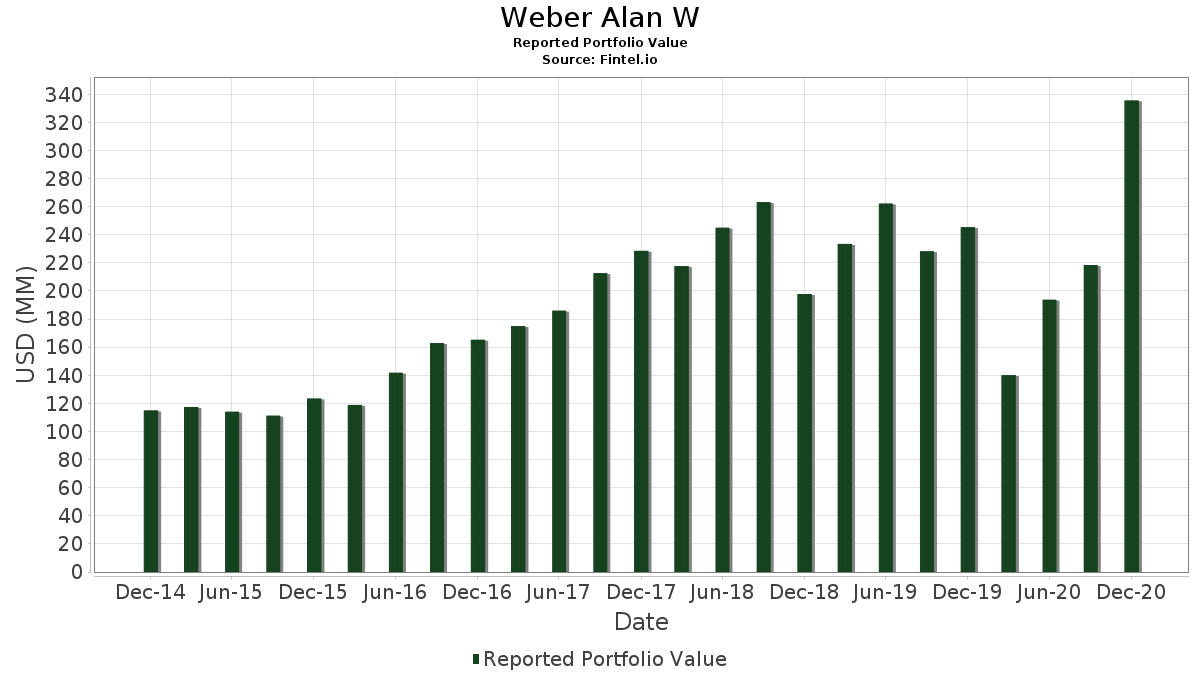
| Valore del portafoglio | $ 335.520.000 |
| Posizioni attuali | 82 |
Ultime partecipazioni, performance, AUM (da depositi 13F, 13D)
Weber Alan W ha dichiarato un totale di 82 partecipazioni negli ultimi documenti depositati presso la SEC. Il valore più recente del portafoglio è pari a $ 335.520.000 USD. Il patrimonio gestito effettivo (AUM) corrisponde a questo valore più la liquidità (che non viene dichiarata). Le principali partecipazioni di Weber Alan W sono RadNet, Inc. (US:RDNT) , Fluent, Inc. (US:FLNT) , Kraton Corp (US:KRA) , Dana Incorporated (US:DAN) , and XPEL, Inc. (US:XPEL) . Le nuove posizioni di Weber Alan W includono Oppenheimer Holdings Inc. (US:OPY) , RigNet Inc (DE:4R5) , Bluegreen Vacations Corp (US:US09629F1084) , Mistras Group, Inc. (US:MG) , and Tutor Perini Corp. Bond (US:US901109AD04) .
Gli aumenti più importanti di questo trimestre
Utilizziamo la variazione dell'allocazione del portafoglio perché è l'indicatore più significativo. Le variazioni possono essere dovute a transazioni o a variazioni dei prezzi delle azioni.
| Titolo | Azioni (in milioni) |
Valore (in milioni di $) |
Portafoglio % | ΔPortafoglio % |
|---|---|---|---|---|
| FLNT / Fluent, Inc. | 5,82 | 30,91 | 9,2129 | 2,6047 |
| OPY / Oppenheimer Holdings Inc. | 0,16 | 4,96 | 1,4768 | 1,4768 |
| XPEL / XPEL, Inc. | 0,39 | 20,23 | 6,0286 | 1,3456 |
| RYI / Ryerson Holding Corporation | 0,54 | 7,36 | 2,1927 | 0,7779 |
| TSE / Trinseo PLC | 0,17 | 8,55 | 2,5489 | 0,6173 |
| SPWH / Sportsman's Warehouse Holdings, Inc. | 0,94 | 16,58 | 4,9416 | 0,5987 |
| DAN / Dana Incorporated | 1,25 | 24,32 | 7,2479 | 0,3820 |
| HBP / Huttig Building Products, Inc. | 2,46 | 9,15 | 2,7277 | 0,2615 |
| 4R5 / RigNet Inc | 0,14 | 0,82 | 0,2459 | 0,2459 |
| US09629F1084 / Bluegreen Vacations Corp | 0,06 | 0,77 | 0,2289 | 0,2289 |
Gli aumenti più importanti di questo trimestre
Utilizziamo la variazione dell'allocazione del portafoglio perché è l'indicatore più significativo. Le variazioni possono essere dovute a transazioni o a variazioni dei prezzi delle azioni.
| Titolo | Azioni (in milioni) |
Valore (in milioni di $) |
Portafoglio % | ΔPortafoglio % |
|---|---|---|---|---|
| RDNT / RadNet, Inc. | 3,32 | 65,01 | 19,3747 | -3,9637 |
| / BMC Stock Holdings, Inc. | 0,20 | 10,48 | 3,1238 | -1,5862 |
| US8326822074 / SMTC Corp. | 0,05 | 0,25 | 0,0739 | -1,1381 |
| ARCH / Arch Resources, Inc. | 0,17 | 7,66 | 2,2830 | -0,4391 |
| BXC / BlueLinx Holdings Inc. | 0,46 | 13,42 | 3,9998 | -0,4214 |
| US69329Y1047 / PDL BioPharma, Inc. | 0,00 | 0,00 | -0,2884 | |
| BLDR / Builders FirstSource, Inc. | 0,10 | 4,08 | 1,2163 | -0,2768 |
| US05491N1046 / BBX Capital Corporation | 0,00 | 0,00 | -0,2669 | |
| FSV / FirstService Corporation | 0,01 | 1,38 | 0,4119 | -0,1982 |
| USAK / USA Truck, Inc. | 0,08 | 0,71 | 0,2128 | -0,1332 |
13F e depositi di fondi
Questo modulo è stato depositato il 2021-02-16 per il periodo di riferimento 2020-12-31. Fai clic sull'icona del link per visualizzare la cronologia completa delle transazioni.
Esegui l'upgrade per sbloccare i dati premium ed esportarli in Excel ![]() .
.
| Titolo | Tipo | Prezzo medio dell'azione | Azioni (in milioni) |
ΔAzioni (%) |
Valore (in milioni di $) |
ΔValore (%) |
Portafoglio (%) |
ΔPortafoglio (%) |
|
|---|---|---|---|---|---|---|---|---|---|
| RDNT / RadNet, Inc. | 3,32 | 0,00 | 65,01 | 27,49 | 19,3747 | -3,9637 | |||
| FLNT / Fluent, Inc. | 5,82 | 0,00 | 30,91 | 114,11 | 9,2129 | 2,6047 | |||
| KRA / Kraton Corp | 0,90 | 0,00 | 25,12 | 55,95 | 7,4884 | 0,1140 | |||
| DAN / Dana Incorporated | 1,25 | 2,96 | 24,32 | 62,12 | 7,2479 | 0,3820 | |||
| XPEL / XPEL, Inc. | 0,39 | 0,00 | 20,23 | 97,70 | 6,0286 | 1,3456 | |||
| SPWH / Sportsman's Warehouse Holdings, Inc. | 0,94 | 42,50 | 16,58 | 74,75 | 4,9416 | 0,5987 | |||
| BXC / BlueLinx Holdings Inc. | 0,46 | 2,23 | 13,42 | 38,94 | 3,9998 | -0,4214 | |||
| / BMC Stock Holdings, Inc. | 0,20 | -18,73 | 10,48 | 1,86 | 3,1238 | -1,5862 | |||
| HBP / Huttig Building Products, Inc. | 2,46 | 0,00 | 9,15 | 69,86 | 2,7277 | 0,2615 | |||
| TSE / Trinseo PLC | 0,17 | 0,00 | 8,55 | 102,65 | 2,5489 | 0,6173 | |||
| ARCH / Arch Resources, Inc. | 0,17 | 25,00 | 7,66 | 28,80 | 2,2830 | -0,4391 | |||
| RYI / Ryerson Holding Corporation | 0,54 | 0,00 | 7,36 | 138,01 | 2,1927 | 0,7779 | |||
| VCTR / Victory Capital Holdings, Inc. | 0,26 | 17,99 | 6,37 | 73,34 | 1,8991 | 0,2166 | |||
| LCUT / Lifetime Brands, Inc. | 0,40 | 0,00 | 6,02 | 62,05 | 1,7933 | 0,0938 | |||
| EAF / GrafTech International Ltd. | 0,55 | 0,00 | 5,81 | 55,85 | 1,7316 | 0,0253 | |||
| SBGI / Sinclair, Inc. | 0,18 | 0,00 | 5,73 | 65,65 | 1,7087 | 0,1245 | |||
| TCS / The Container Store Group, Inc. | 0,52 | 0,00 | 4,96 | 53,61 | 1,4783 | 0,0003 | |||
| OPY / Oppenheimer Holdings Inc. | 0,16 | 4,96 | 1,4768 | 1,4768 | |||||
| GTN / Gray Media, Inc. | 0,27 | 12,64 | 4,78 | 46,33 | 1,4252 | -0,0706 | |||
| CSV / Carriage Services, Inc. | 0,13 | 0,00 | 4,11 | 40,90 | 1,2259 | -0,1102 | |||
| BLDR / Builders FirstSource, Inc. | 0,10 | 0,00 | 4,08 | 25,11 | 1,2163 | -0,2768 | |||
| III / Information Services Group, Inc. | 1,05 | 0,00 | 3,43 | 55,46 | 1,0226 | 0,0124 | |||
| PKOH / Park-Ohio Holdings Corp. | 0,10 | 0,00 | 2,99 | 93,28 | 0,8918 | 0,1832 | |||
| CVEO / Civeo Corporation | 0,19 | -90,88 | 2,69 | 87,80 | 0,8026 | 0,1463 | |||
| CIGI / Colliers International Group Inc. | 0,03 | 0,00 | 2,68 | 33,62 | 0,7997 | -0,1195 | |||
| RICK / RCI Hospitality Holdings, Inc. | 0,06 | 0,00 | 2,37 | 93,30 | 0,7052 | 0,1449 | |||
| MTOR / Meritor Inc | 0,07 | 0,00 | 2,03 | 33,29 | 0,6038 | -0,0919 | |||
| IESC / IES Holdings, Inc. | 0,04 | 0,00 | 1,93 | 45,00 | 0,5743 | -0,0340 | |||
| VFF / Village Farms International, Inc. | 0,18 | 0,00 | 1,82 | 121,48 | 0,5439 | 0,1668 | |||
| FVE / Five Star Senior Living Inc. | 0,23 | 0,00 | 1,59 | 36,02 | 0,4727 | -0,0610 | |||
| AXL / Dauch Corporation | 0,18 | 0,00 | 1,52 | 44,54 | 0,4536 | -0,0284 | |||
| NSIT / Insight Enterprises, Inc. | 0,02 | 0,00 | 1,52 | 34,45 | 0,4536 | -0,0645 | |||
| ARC / ARC Document Solutions, Inc. | 0,97 | 0,00 | 1,44 | 64,54 | 0,4301 | 0,0287 | |||
| FSV / FirstService Corporation | 0,01 | 0,00 | 1,38 | 3,68 | 0,4119 | -0,1982 | |||
| AXR / AMREP Corporation | 0,14 | 0,00 | 1,21 | 52,40 | 0,3597 | -0,0028 | |||
| TSQ / Townsquare Media, Inc. | 0,16 | 0,00 | 1,06 | 42,91 | 0,3156 | -0,0235 | |||
| ATKR / Atkore Inc. | 0,03 | 0,00 | 1,03 | 81,34 | 0,3070 | 0,0470 | |||
| ADNT / Adient plc | 0,03 | 0,00 | 0,94 | 100,64 | 0,2793 | 0,0655 | |||
| DLA / Delta Apparel, Inc. | 0,04 | 0,00 | 0,83 | 42,22 | 0,2480 | -0,0198 | |||
| 4R5 / RigNet Inc | 0,14 | 0,82 | 0,2459 | 0,2459 | |||||
| HZN / Horizon Global Corp | 0,09 | 0,00 | 0,81 | 49,26 | 0,2420 | -0,0070 | |||
| US09629F1084 / Bluegreen Vacations Corp | 0,06 | 0,77 | 0,2289 | 0,2289 | |||||
| BBCP / Concrete Pumping Holdings, Inc. | 0,19 | 0,00 | 0,73 | 7,37 | 0,2170 | -0,0934 | |||
| USAK / USA Truck, Inc. | 0,08 | 0,00 | 0,71 | -5,56 | 0,2128 | -0,1332 | |||
| SAR / Saratoga Investment Corp. | 0,03 | 0,00 | 0,71 | 26,98 | 0,2104 | -0,0441 | |||
| TRS / TriMas Corporation | 0,02 | 0,00 | 0,71 | 38,98 | 0,2104 | -0,0221 | |||
| ZEUS / Olympic Steel, Inc. | 0,05 | 0,00 | 0,69 | 17,41 | 0,2051 | -0,0632 | |||
| MKSI / MKS Inc. | 0,00 | 0,00 | 0,66 | 37,71 | 0,1970 | -0,0227 | |||
| FSK / FS KKR Capital Corp. | 0,04 | 0,00 | 0,62 | 4,37 | 0,1851 | -0,0873 | |||
| CVGI / Commercial Vehicle Group, Inc. | 0,07 | 0,00 | 0,58 | 32,27 | 0,1735 | -0,0279 | |||
| MG / Mistras Group, Inc. | 0,07 | 0,58 | 0,1735 | 0,1735 | |||||
| RUSHA / Rush Enterprises, Inc. | 0,01 | 49,99 | 0,56 | 84,92 | 0,1681 | 0,0285 | |||
| FIX / Comfort Systems USA, Inc. | 0,01 | 0,00 | 0,55 | 2,41 | 0,1648 | -0,0824 | |||
| RUSHB / Rush Enterprises, Inc. | 0,01 | 49,99 | 0,52 | 93,26 | 0,1538 | 0,0316 | |||
| ELVT / Elevate Credit Inc | 0,12 | 0,00 | 0,48 | 55,52 | 0,1428 | 0,0018 | |||
| VRTV / Veritiv Corp | 0,02 | 20,38 | 0,48 | 97,51 | 0,1419 | 0,0316 | |||
| GSIT / GSI Technology, Inc. | 0,06 | 0,00 | 0,43 | 31,19 | 0,1279 | -0,0218 | |||
| INSE / Inspired Entertainment, Inc. | 0,07 | 0,00 | 0,43 | 122,92 | 0,1276 | 0,0397 | |||
| ASUR / Asure Software, Inc. | 0,06 | 0,00 | 0,43 | 13,60 | 0,1270 | -0,0447 | |||
| AUD / Audacy Inc - Class A | 0,17 | -24,73 | 0,41 | 15,36 | 0,1231 | -0,0408 | |||
| VAC / Marriott Vacations Worldwide Corporation | 0,00 | 0,00 | 0,40 | 51,32 | 0,1195 | -0,0018 | |||
| US901109AD04 / Tutor Perini Corp. Bond | 0,03 | 0,39 | 0,1159 | 0,1159 | |||||
| SCPL / Sciplay Corp - Class A | 0,03 | 0,00 | 0,35 | -14,78 | 0,1031 | -0,0827 | |||
| MNTX / Manitex International, Inc. | 0,07 | 0,00 | 0,34 | 23,83 | 0,1022 | -0,0246 | |||
| WSC / WillScot Holdings Corporation | 0,01 | 0,00 | 0,34 | 39,02 | 0,1019 | 0,1019 | |||
| HDSN / Hudson Technologies, Inc. | 0,31 | 0,00 | 0,33 | -5,11 | 0,0995 | -0,0616 | |||
| AGFS / AgroFresh Solutions Inc | 0,14 | 0,00 | 0,33 | -6,57 | 0,0975 | -0,0627 | |||
| IEC / IEC Electronics Corp. | 0,02 | 0,00 | 0,30 | 56,84 | 0,0888 | 0,0019 | |||
| PCOM / Points.com Inc | 0,02 | 0,00 | 0,29 | 47,94 | 0,0855 | -0,0033 | |||
| US8326822074 / SMTC Corp. | 0,05 | 0,00 | 0,25 | -90,63 | 0,0739 | -1,1381 | |||
| HNGR / Hanger Inc | 0,01 | 0,00 | 0,22 | 39,24 | 0,0656 | -0,0068 | |||
| TDW / Tidewater Inc. | 0,03 | 0,00 | 0,22 | 28,57 | 0,0644 | -0,0125 | |||
| LXU / LSB Industries, Inc. | 0,05 | 0,00 | 0,17 | 109,88 | 0,0507 | 0,0136 | |||
| CEIX / CONSOL Energy Inc. | 0,02 | -46,39 | 0,17 | -12,57 | 0,0498 | -0,0377 | |||
| KLXE / KLX Energy Services Holdings, Inc. | 0,02 | -50,00 | 0,13 | -22,29 | 0,0384 | -0,0375 | |||
| LNSR / LENSAR, Inc. | 0,02 | 0,11 | 0,0328 | 0,0328 | |||||
| WRLD / World Acceptance Corporation | 0,00 | 0,00 | 0,11 | -3,54 | 0,0325 | -0,0192 | |||
| XELB / Xcel Brands, Inc. | 0,09 | 0,00 | 0,11 | 57,97 | 0,0325 | 0,0009 | |||
| KTOS / Kratos Defense & Security Solutions, Inc. | 0,00 | 0,00 | 0,09 | 66,67 | 0,0268 | 0,0021 | |||
| EVFM / Evofem Biosciences, Inc. | 0,02 | 0,00 | 0,06 | 1,82 | 0,0167 | -0,0085 | |||
| GENN / Genesis Healthcare, Inc. | 0,10 | 0,00 | 0,05 | -11,11 | 0,0143 | -0,0104 | |||
| SSNT / SilverSun Technologies, Inc. | 0,01 | 0,03 | 0,0086 | 0,0086 | |||||
| DXLG / Destination XL Group, Inc. | 0,00 | -100,00 | 0,00 | -100,00 | -0,0037 | ||||
| GTX / Garrett Motion Inc. | 0,00 | -100,00 | 0,00 | -100,00 | -0,1025 | ||||
| PHX / PHX Minerals Inc. | 0,00 | -100,00 | 0,00 | -100,00 | -0,0096 | ||||
| US69329Y1047 / PDL BioPharma, Inc. | 0,00 | -100,00 | 0,00 | -100,00 | -0,2884 | ||||
| US05491N1046 / BBX Capital Corporation | 0,00 | -100,00 | 0,00 | -100,00 | -0,2669 |