Statistiche di base
| Valore del portafoglio | $ 295.497.598 |
| Posizioni attuali | 46 |
Ultime partecipazioni, performance, AUM (da depositi 13F, 13D)
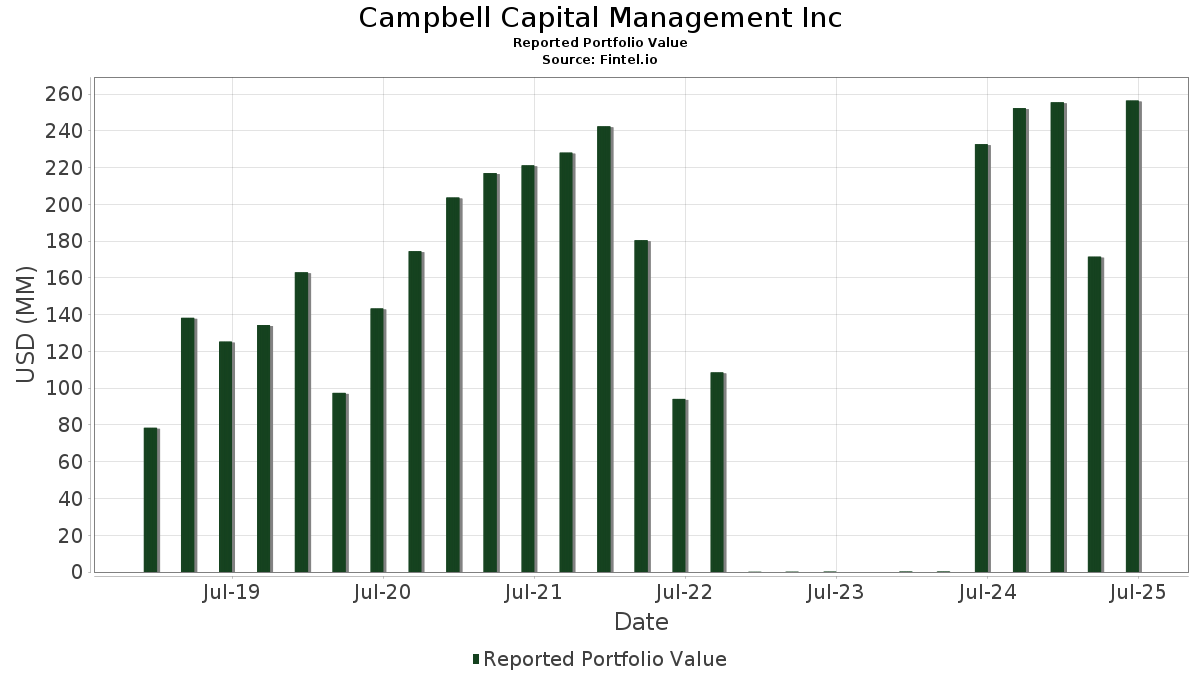
Campbell Capital Management Inc ha dichiarato un totale di 46 partecipazioni negli ultimi documenti depositati presso la SEC. Il valore più recente del portafoglio è pari a $ 295.497.598 USD. Il patrimonio gestito effettivo (AUM) corrisponde a questo valore più la liquidità (che non viene dichiarata). Le principali partecipazioni di Campbell Capital Management Inc sono Alphabet Inc. (US:GOOG) , Apple Inc. (US:AAPL) , Microsoft Corporation (US:MSFT) , Meta Platforms, Inc. (US:META) , and KKR & Co. Inc. (US:KKR) . Le nuove posizioni di Campbell Capital Management Inc includono Kimberly-Clark Corporation (US:KMB) , SPDR Gold Shares (US:GLD) , Nasdaq, Inc. (US:NDAQ) , Ameriprise Financial, Inc. (US:AMP) , and Phillips 66 (IT:4PSX) .
Gli aumenti più importanti di questo trimestre
Utilizziamo la variazione dell'allocazione del portafoglio perché è l'indicatore più significativo. Le variazioni possono essere dovute a transazioni o a variazioni dei prezzi delle azioni.
| Titolo | Azioni (in milioni) |
Valore (in milioni di $) |
Portafoglio % | ΔPortafoglio % |
|---|---|---|---|---|
| TOST / Toast, Inc. | 0,28 | 9,81 | 3,3205 | 3,3205 |
| INTU / Intuit Inc. | 0,01 | 7,95 | 2,6908 | 2,6908 |
| AVGO / Broadcom Inc. | 0,02 | 7,44 | 2,5182 | 2,5182 |
| KMB / Kimberly-Clark Corporation | 0,07 | 7,16 | 2,4246 | 2,4246 |
| GOOG / Alphabet Inc. | 0,16 | 49,75 | 16,8351 | 1,9862 |
| CVX / Chevron Corporation | 0,05 | 7,18 | 2,4305 | 1,7953 |
| NFLX / Netflix, Inc. | 0,05 | 4,54 | 1,5357 | 1,5357 |
| NOW / ServiceNow, Inc. | 0,02 | 3,61 | 1,2203 | 1,2203 |
| GLD / SPDR Gold Shares | 0,01 | 2,51 | 0,8483 | 0,8483 |
| NDAQ / Nasdaq, Inc. | 0,02 | 2,38 | 0,8053 | 0,8053 |
Gli aumenti più importanti di questo trimestre
Utilizziamo la variazione dell'allocazione del portafoglio perché è l'indicatore più significativo. Le variazioni possono essere dovute a transazioni o a variazioni dei prezzi delle azioni.
| Titolo | Azioni (in milioni) |
Valore (in milioni di $) |
Portafoglio % | ΔPortafoglio % |
|---|---|---|---|---|
| LEN / Lennar Corporation | 0,00 | 0,00 | -1,9553 | |
| MSFT / Microsoft Corporation | 0,05 | 24,35 | 8,2405 | -1,7858 |
| VST / Vistra Corp. | 0,06 | 9,24 | 3,1255 | -1,1836 |
| DKS / DICK'S Sporting Goods, Inc. | 0,05 | 10,02 | 3,3905 | -0,9551 |
| META / Meta Platforms, Inc. | 0,02 | 13,54 | 4,5830 | -0,9276 |
| AAPL / Apple Inc. | 0,15 | 40,56 | 13,7259 | -0,8821 |
| UBER / Uber Technologies, Inc. | 0,05 | 3,92 | 1,3277 | -0,7416 |
| MRK / Merck & Co., Inc. | 0,00 | 0,00 | -0,7186 | |
| KKR / KKR & Co. Inc. | 0,09 | 11,83 | 4,0035 | -0,6629 |
| MU / Micron Technology, Inc. | 0,02 | 5,85 | 1,9800 | -0,4238 |
13F e depositi di fondi
Questo modulo è stato depositato il 2026-01-28 per il periodo di riferimento 2025-12-31. Fai clic sull'icona del link per visualizzare la cronologia completa delle transazioni.
Esegui l'upgrade per sbloccare i dati premium ed esportarli in Excel ![]() .
.
| Titolo | Tipo | Prezzo medio dell'azione | Azioni (in milioni) |
ΔAzioni (%) |
Valore (in milioni di $) |
ΔAzioni (%) |
Portafoglio (%) |
ΔPortafoglio (%) |
|
|---|---|---|---|---|---|---|---|---|---|
| GOOG / Alphabet Inc. | 0,16 | 0,13 | 49,75 | 29,01 | 16,8351 | 1,9862 | |||
| AAPL / Apple Inc. | 0,15 | 0,14 | 40,56 | 6,92 | 13,7259 | -0,8821 | |||
| MSFT / Microsoft Corporation | 0,05 | 0,16 | 24,35 | -6,48 | 8,2405 | -1,7858 | |||
| META / Meta Platforms, Inc. | 0,02 | 5,29 | 13,54 | -5,37 | 4,5830 | -0,9276 | |||
| KKR / KKR & Co. Inc. | 0,09 | -0,48 | 11,83 | -2,37 | 4,0035 | -0,6629 | |||
| DELL / Dell Technologies Inc. | 0,08 | 34,03 | 10,09 | 19,02 | 3,4160 | 0,1499 | |||
| DKS / DICK'S Sporting Goods, Inc. | 0,05 | -0,34 | 10,02 | -11,23 | 3,3905 | -0,9551 | |||
| AMZN / Amazon.com, Inc. | 0,04 | 3,19 | 9,93 | 8,48 | 3,3604 | -0,1646 | |||
| TOST / Toast, Inc. | 0,28 | 9,81 | 3,3205 | 3,3205 | |||||
| VST / Vistra Corp. | 0,06 | 0,23 | 9,24 | -17,47 | 3,1255 | -1,1836 | |||
| COF / Capital One Financial Corporation | 0,04 | 0,14 | 8,73 | 14,18 | 2,9538 | 0,0099 | |||
| INTU / Intuit Inc. | 0,01 | 7,95 | 2,6908 | 2,6908 | |||||
| AVGO / Broadcom Inc. | 0,02 | 7,44 | 2,5182 | 2,5182 | |||||
| CVX / Chevron Corporation | 0,05 | 343,64 | 7,18 | 335,48 | 2,4305 | 1,7953 | |||
| KMB / Kimberly-Clark Corporation | 0,07 | 7,16 | 2,4246 | 2,4246 | |||||
| GEHC / GE HealthCare Technologies Inc. | 0,08 | -0,67 | 6,56 | 8,49 | 2,2193 | -0,1087 | |||
| NU / Nu Holdings Ltd. | 0,39 | 0,30 | 6,48 | 4,87 | 2,1946 | -0,1866 | |||
| MU / Micron Technology, Inc. | 0,02 | -45,05 | 5,85 | -6,28 | 1,9800 | -0,4238 | |||
| NFLX / Netflix, Inc. | 0,05 | 4,54 | 1,5357 | 1,5357 | |||||
| TWLO / Twilio Inc. | 0,03 | -14,37 | 4,40 | 21,69 | 1,4890 | 0,0966 | |||
| UBER / Uber Technologies, Inc. | 0,05 | -12,46 | 3,92 | -26,99 | 1,3277 | -0,7416 | |||
| NOW / ServiceNow, Inc. | 0,02 | 3,61 | 1,2203 | 1,2203 | |||||
| JPC / Nuveen Preferred & Income Opportunities Fund | 0,35 | -1,18 | 2,82 | -2,25 | 0,9558 | -0,1570 | |||
| KO / The Coca-Cola Company | 0,04 | 0,06 | 2,63 | 5,49 | 0,8904 | -0,0702 | |||
| QQQ / Invesco QQQ Trust, Series 1 | 0,00 | -3,50 | 2,63 | -1,28 | 0,8896 | -0,1355 | |||
| GLD / SPDR Gold Shares | 0,01 | 2,51 | 0,8483 | 0,8483 | |||||
| FLRT / Pacer Funds Trust - Pacer Aristotle Pacific Floating Rate High Income ETF | 0,05 | 32,77 | 2,48 | 32,06 | 0,8396 | 0,1161 | |||
| NDAQ / Nasdaq, Inc. | 0,02 | 2,38 | 0,8053 | 0,8053 | |||||
| FSK / FS KKR Capital Corp. | 0,16 | -0,95 | 2,32 | -1,78 | 0,7861 | -0,1243 | |||
| RDDT / Reddit, Inc. | 0,01 | 125,14 | 2,27 | 125,15 | 0,7697 | 0,3805 | |||
| WEC / WEC Energy Group, Inc. | 0,02 | -1,05 | 2,09 | -8,90 | 0,7063 | -0,1762 | |||
| ET / Energy Transfer LP - Limited Partnership | 0,13 | 70,41 | 2,08 | 63,83 | 0,7037 | 0,2147 | |||
| BRK.B / Berkshire Hathaway Inc. | 0,00 | 0,00 | 1,58 | -0,06 | 0,5357 | -0,0740 | |||
| HESM / Hess Midstream LP | 0,03 | 0,00 | 1,13 | -0,09 | 0,3818 | -0,0533 | |||
| AMP / Ameriprise Financial, Inc. | 0,00 | 0,95 | 0,3206 | 0,3206 | |||||
| 4PSX / Phillips 66 | 0,01 | 0,90 | 0,3057 | 0,3057 | |||||
| ACN / Accenture plc | 0,00 | 0,67 | 0,2252 | 0,2252 | |||||
| HD / The Home Depot, Inc. | 0,00 | 0,00 | 0,60 | -15,07 | 0,2041 | -0,0694 | |||
| SYK / Stryker Corporation | 0,00 | 0,00 | 0,46 | -5,00 | 0,1546 | -0,0304 | |||
| OSW / OneSpaWorld Holdings Limited | 0,02 | 0,41 | 0,1404 | 0,1404 | |||||
| LOW / Lowe's Companies, Inc. | 0,00 | 0,00 | 0,39 | -4,23 | 0,1306 | -0,0243 | |||
| VGT / Vanguard World Fund - Vanguard Information Technology ETF | 0,00 | 0,00 | 0,38 | 1,08 | 0,1273 | -0,0162 | |||
| JNJ / Johnson & Johnson | 0,00 | 0,00 | 0,37 | 11,71 | 0,1261 | -0,0025 | |||
| TKO / TKO Group Holdings, Inc. | 0,00 | 0,00 | 0,21 | 3,98 | 0,0707 | -0,0070 | |||
| VOO / Vanguard Index Funds - Vanguard S&P 500 ETF | 0,00 | 0,20 | 0,0681 | 0,0681 | |||||
| BHR / Braemar Hotels & Resorts Inc. | 0,03 | 0,09 | 0,0291 | 0,0291 | |||||
| MRVL / Marvell Technology, Inc. | 0,00 | -100,00 | 0,00 | 0,0000 | |||||
| WSO / Watsco, Inc. | 0,00 | -100,00 | 0,00 | 0,0000 | |||||
| RNP / Cohen & Steers REIT and Preferred Income Fund, Inc. | 0,00 | -100,00 | 0,00 | 0,0000 | |||||
| ASML / ASML Holding N.V. - Depositary Receipt (Common Stock) | 0,00 | -100,00 | 0,00 | 0,0000 | |||||
| ADP / Automatic Data Processing, Inc. | 0,00 | -100,00 | 0,00 | 0,0000 | |||||
| LEN / Lennar Corporation | 0,00 | -100,00 | 0,00 | -100,00 | -1,9553 | ||||
| MRK / Merck & Co., Inc. | 0,00 | -100,00 | 0,00 | -100,00 | -0,7186 | ||||
| EVM / Eaton Vance California Municipal Bond Fund | 0,00 | -100,00 | 0,00 | 0,0000 | |||||
| RMD / ResMed Inc. | 0,00 | -100,00 | 0,00 | 0,0000 | |||||
| BA / The Boeing Company | 0,00 | -100,00 | 0,00 | 0,0000 | |||||
| PFF / iShares Trust - iShares Preferred and Income Securities ETF | 0,00 | -100,00 | 0,00 | 0,0000 | |||||
| SBET / Sharplink, Inc. | 0,00 | -100,00 | 0,00 | 0,0000 | |||||
| XLF / The Select Sector SPDR Trust - State Street Financial Select Sector SPDR ETF | 0,00 | -100,00 | 0,00 | 0,0000 |