Statistiche di base
| Proprietari istituzionali | 159 total, 141 long only, 1 short only, 17 long/short - change of 94,12% MRQ |
| Allocazione media del portafoglio | 0.0044 % - change of -44,34% MRQ |
| Azioni istituzionali (Long) | 72.097.479 (ex 13D/G) - change of 4,04MM shares 455,94% MRQ |
| Valore istituzionale (Long) | $ 681.890 USD ($1000) |
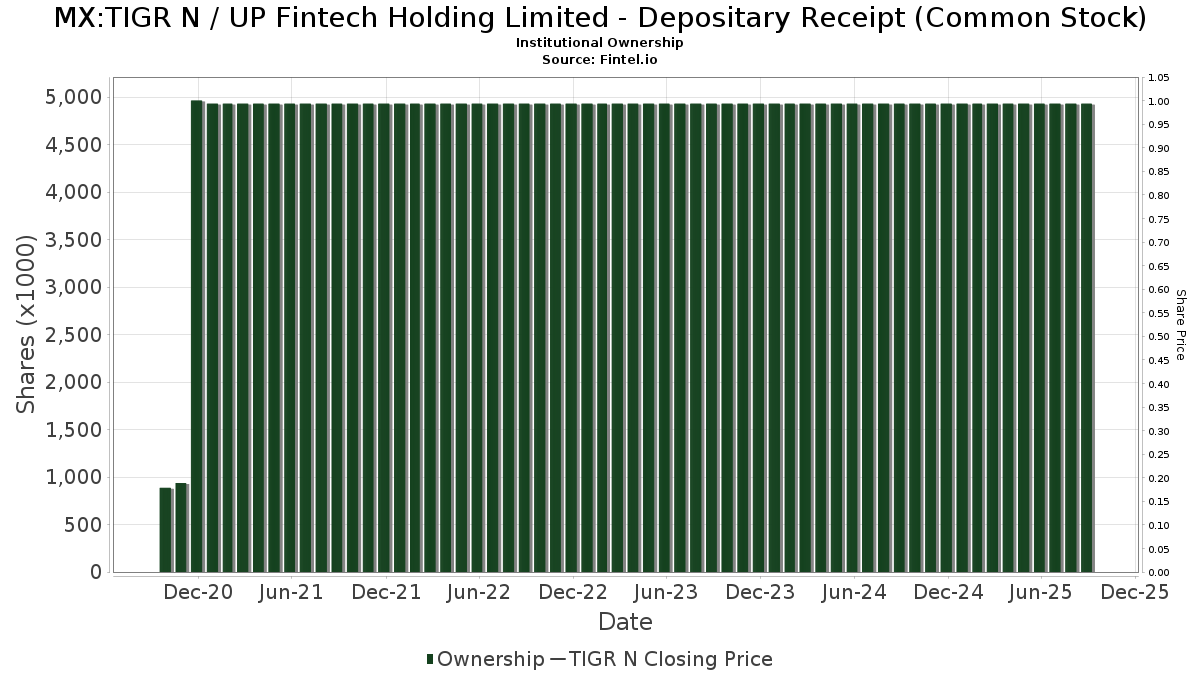
Proprietà istituzionale e azionisti
UP Fintech Holding Limited - Depositary Receipt (Common Stock) (MX:TIGR N) ha 159 proprietari istituzionali e azionisti che hanno presentato i moduli 13D/G o 13F alla Securities Exchange Commission (SEC). Queste istituzioni detengono un totale di 72,097,479 azioni. I maggiori azionisti includono Avenir Tech Ltd, Susquehanna International Group, Llp, Susquehanna International Group, Llp, Sparta 24 Ltd., Jane Street Group, Llc, Jane Street Group, Llc, Group One Trading, L.p., Group One Trading, L.p., Morgan Stanley, and Walleye Trading LLC .
(UP Fintech Holding Limited - Depositary Receipt (Common Stock) (BMV:TIGR N) la struttura proprietaria istituzionale mostra le attuali posizioni nella società da parte di istituzioni e fondi, nonché le ultime variazioni nella dimensione della posizione. I principali azionisti possono essere singoli investitori, fondi comuni, hedge fund o istituzioni. L'allegato 13D indica che l'investitore detiene (o ha detenuto) più del 5% della società e intende (o intendeva) perseguire attivamente un cambiamento nella strategia aziendale. L'allegato 13G indica un investimento passivo superiore al 5%.
Indice del sentiment dei fondi
L'indice del sentiment dei fondi (anche noto come "indice di accumulo di proprietà") individua i titoli più acquistati dai fondi. È il risultato di un sofisticato modello quantitativo multi-fattore che identifica le società con i più alti livelli di accumulo istituzionale. Il modello utilizza una combinazione dell'aumento totale dei proprietari dichiarati, delle variazioni nelle allocazioni di portafoglio di tali proprietari e di altre metriche. Il punteggio varia da 0 a 100: i numeri più alti indicano un livello di accumulo superiore ad altre società, mentre 50 rappresenta la media.
Frequenza di aggiornamento: giornaliera
Consulta Ownership Explorer per visualizzare l'elenco delle aziende con il ranking più alto.
Depositi 13F e NPORT
Le informazioni relative ai depositi 13F sono gratuite. Per accedere alle informazioni relative ai depositi NP è necessario un'abbonamento premium. Le righe verdi indicano le nuove posizioni. Le righe rosse indicano le posizioni chiuse. Fai clic sull'icona del link per visualizzare la cronologia completa delle transazioni.
Esegui l'upgrade
per sbloccare i dati premium ed esportarli in Excel ![]() .
.
| Data di deposito | Fonte | Investitore | Tipo | Prezzo medio (Stima) |
Azioni | Δ Azioni (%) |
Valore dichiarato ($ 1000) |
Δ Valore (%) |
Allocazione del portafoglio (%) |
|
|---|---|---|---|---|---|---|---|---|---|---|
| 2025-08-13 | 13F | Renaissance Technologies Llc | 1.279.100 | 44,74 | 12.343 | 62,62 | ||||
| 2025-08-05 | 13F | Simplex Trading, Llc | Put | 1.366.700 | -26,17 | 13 | -13,33 | |||
| 2025-07-22 | 13F | Gsa Capital Partners Llp | 298.009 | 70,00 | 3 | 100,00 | ||||
| 2025-08-05 | 13F | Simplex Trading, Llc | 504.169 | -35,01 | 5 | -33,33 | ||||
| 2025-08-14 | 13F | Garden State Investment Advisory Services LLC | 0 | -100,00 | 0 | -100,00 | ||||
| 2025-08-05 | 13F | Simplex Trading, Llc | Call | 1.179.200 | -8,45 | 11 | 0,00 | |||
| 2025-08-14 | 13F | D. E. Shaw & Co., Inc. | 1.309.001 | -49,09 | 12.632 | -42,81 | ||||
| 2025-08-14 | 13F | D. E. Shaw & Co., Inc. | Put | 42.400 | 409 | |||||
| 2025-05-15 | 13F | Oasis Management Co Ltd. | Call | 0 | -100,00 | 0 | -100,00 | |||
| 2025-07-30 | 13F | Wallace Advisory Group, LLC | 13.506 | -1,21 | 116 | 31,82 | ||||
| 2025-07-23 | 13F | Bingham Private Wealth, Llc | 12.752 | 21,07 | 123 | 36,67 | ||||
| 2025-08-13 | 13F | CMT Capital Markets Trading GmbH | 0 | -100,00 | 0 | -100,00 | ||||
| 2025-05-13 | 13F | HighTower Advisors, LLC | Call | 0 | -100,00 | 0 | -100,00 | |||
| 2025-07-30 | 13F | D.a. Davidson & Co. | 19.500 | 188 | ||||||
| 2025-08-14 | 13F | Wellington Management Group Llp | 15.235 | 147 | ||||||
| 2025-08-11 | 13F | Citigroup Inc | 40.182 | 116,65 | 388 | 143,40 | ||||
| 2025-05-07 | 13F | Nkcfo Llc | 0 | -100,00 | 0 | |||||
| 2025-08-14 | 13F | Eschler Asset Management LLP | 41.147 | -65,71 | 397 | -61,46 | ||||
| 2025-08-13 | 13F | Pictet Asset Management Holding SA | 39.600 | -40,18 | 382 | -32,75 | ||||
| 2025-08-14 | 13F | Mml Investors Services, Llc | 19.709 | 0 | ||||||
| 2025-06-27 | NP | PGJ - Invesco Golden Dragon China ETF This fund is a listed as child fund of Invesco Ltd. and if that institution has disclosed ownership in this security, then these positions will not be double counted when calculating total shares and total value | 113.120 | 9,88 | 933 | 28,69 | ||||
| 2025-08-08 | 13F | Alberta Investment Management Corp | 10.500 | 0,00 | 101 | 12,22 | ||||
| 2025-05-15 | 13F | Dymon Asia Capital (singapore) Pte. Ltd. | 0 | -100,00 | 0 | -100,00 | ||||
| 2025-08-14 | 13F | Avenir Tech Ltd | Put | 610.400 | 5.890 | |||||
| 2025-08-12 | 13F | Rhumbline Advisers | 4.202 | -28,92 | 41 | -20,00 | ||||
| 2025-08-14 | 13F | Avenir Tech Ltd | 10.667.581 | 296,58 | 102.942 | 345,52 | ||||
| 2025-08-27 | 13F/A | Squarepoint Ops LLC | Put | 168.900 | 1.630 | |||||
| 2025-07-11 | 13F | Farther Finance Advisors, LLC | 17 | 0,00 | 0 | |||||
| 2025-08-27 | 13F/A | Squarepoint Ops LLC | 68.674 | 17,95 | 663 | 32,40 | ||||
| 2025-08-14 | 13F | Parallax Volatility Advisers, L.P. | Put | 157.100 | 1.046,72 | 1.516 | 1.195,73 | |||
| 2025-08-14 | 13F | Parallax Volatility Advisers, L.P. | Call | 7.500 | -73,21 | 72 | -70,00 | |||
| 2025-08-14 | 13F | Parallax Volatility Advisers, L.P. | 347.213 | 25,22 | 3.351 | 40,70 | ||||
| 2025-06-23 | NP | UGPIX - UltraChina ProFund Investor Class | 4.347 | -34,91 | 36 | -25,53 | ||||
| 2025-08-01 | 13F | Envestnet Asset Management Inc | 218.480 | 21,15 | 2.108 | 36,09 | ||||
| 2025-07-24 | NP | ONEQ - Fidelity Nasdaq Composite Index Tracking Stock This fund is a listed as child fund of Fmr Llc and if that institution has disclosed ownership in this security, then these positions will not be double counted when calculating total shares and total value | 41.806 | -33,93 | 339 | 33,46 | ||||
| 2025-08-14 | 13F | Ionic Capital Management LLC | Call | 0 | -100,00 | 0 | ||||
| 2025-08-14 | 13F | Susquehanna International Group, Llp | 1.982.850 | 9,45 | 19.135 | 22,95 | ||||
| 2025-08-28 | NP | SPEM - SPDR(R) Portfolio Emerging Markets ETF | 121.262 | 1,93 | 1.170 | 14,59 | ||||
| 2025-08-14 | 13F | Susquehanna International Group, Llp | Call | 7.540.500 | 26,87 | 72.766 | 42,52 | |||
| 2025-08-14 | 13F | Susquehanna International Group, Llp | Put | 7.587.600 | 184,55 | 73.220 | 219,67 | |||
| 2025-08-14 | 13F | CoreCap Advisors, LLC | 1 | 0,00 | 0 | |||||
| 2025-07-11 | 13F | Harbour Capital Advisors, LLC | 67.525 | -2,58 | 646 | 12,35 | ||||
| 2025-09-04 | 13F/A | Advisor Group Holdings, Inc. | 63.279 | 638,38 | 611 | 735,62 | ||||
| 2025-05-05 | 13F | Creekmur Asset Management LLC | 0 | -100,00 | 0 | |||||
| 2025-08-14 | 13F | Ubs Asset Management Americas Inc | 110.200 | -15,30 | 1.063 | -4,83 | ||||
| 2025-08-04 | 13F | Quaker Wealth Management, LLC | Put | 0 | -100,00 | 0 | -100,00 | |||
| 2025-08-11 | 13F | Principal Securities, Inc. | 0 | -100,00 | 0 | |||||
| 2025-08-14 | 13F | Bnp Paribas Arbitrage, Sa | 161.179 | -16,20 | 1.555 | -5,87 | ||||
| 2025-07-28 | NP | HROAX - FinTrust Income and Opportunity Fund Class A Shares | 75.000 | -11,76 | 608 | -1,14 | ||||
| 2025-08-05 | 13F | Claro Advisors LLC | 0 | -100,00 | 0 | |||||
| 2025-08-14 | 13F | Caption Management, LLC | Call | 80.000 | 0,00 | 772 | 12,37 | |||
| 2025-08-14 | 13F | Alliancebernstein L.p. | 24.710 | 238 | ||||||
| 2025-08-25 | NP | AADR - AdvisorShares Dorsey Wright ADR ETF | 154.066 | 27,32 | 1.487 | 43,02 | ||||
| 2025-08-13 | 13F | Jones Financial Companies Lllp | 11.542 | 46.068,00 | 109 | |||||
| 2025-08-14 | 13F | Royal Bank Of Canada | 6.548 | -57,08 | 63 | -51,91 | ||||
| 2025-08-14 | 13F | D. E. Shaw & Co., Inc. | Call | 520.000 | 147,62 | 5.018 | 178,31 | |||
| 2025-08-14 | 13F | Goldman Sachs Group Inc | 2.544.456 | 19,24 | 24.554 | 33,96 | ||||
| 2025-08-14 | 13F | Canada Pension Plan Investment Board | 1.274.250 | 15,63 | 12.297 | 29,90 | ||||
| 2025-07-28 | NP | AVSE - Avantis Responsible Emerging Markets Equity ETF | 126 | 0,00 | 1 | |||||
| 2025-08-13 | 13F | Walleye Trading LLC | 1.131.801 | -12,59 | 10.922 | -1,81 | ||||
| 2025-08-13 | 13F | Walleye Trading LLC | Put | 3.514.100 | 0,85 | 33.911 | 13,30 | |||
| 2025-07-28 | NP | AVEE - Avantis Emerging Markets Small Cap Equity ETF | 5.362 | 42,04 | 43 | 59,26 | ||||
| 2025-08-14 | 13F | Verition Fund Management LLC | 313.660 | 98,36 | 3.027 | 122,83 | ||||
| 2025-08-13 | 13F | Walleye Trading LLC | Call | 536.300 | -27,96 | 5.175 | -19,06 | |||
| 2025-08-12 | 13F | Deutsche Bank Ag\ | 8.902 | 49,71 | 86 | 66,67 | ||||
| 2025-08-14 | 13F | Bank Of America Corp /de/ | 2.282.337 | 122,65 | 22.025 | 150,13 | ||||
| 2025-07-25 | 13F | JustInvest LLC | 13.517 | 14,15 | 130 | 28,71 | ||||
| 2025-08-14 | 13F/A | Barclays Plc | 122.435 | 10,52 | 1 | |||||
| 2025-08-14 | 13F | Banque Transatlantique SA | 0 | -100,00 | 0 | |||||
| 2025-08-14 | 13F | Prelude Capital Management, Llc | 20.000 | 193 | ||||||
| 2025-07-15 | 13F | Burns Matteson Capital Management, LLC | 26.119 | 42,57 | 252 | 60,51 | ||||
| 2025-08-14 | 13F | Lighthouse Investment Partners, LLC | 0 | -100,00 | 0 | |||||
| 2025-08-12 | 13F | Handelsbanken Fonder AB | 27.000 | 33,00 | 0 | |||||
| 2025-08-08 | 13F | Wrapmanager Inc | 16.149 | -3,23 | 156 | 8,39 | ||||
| 2025-08-12 | 13F | Virtu Financial LLC | 59.864 | -12,36 | 1 | |||||
| 2025-07-24 | NP | FNCMX - Fidelity Nasdaq Composite Index Fund This fund is a listed as child fund of Fmr Llc and if that institution has disclosed ownership in this security, then these positions will not be double counted when calculating total shares and total value | 80.177 | 0,00 | 650 | 12,07 | ||||
| 2025-08-11 | 13F | HighTower Advisors, LLC | 60.555 | 114,36 | 584 | 141,32 | ||||
| 2025-08-14 | 13F | Van Eck Associates Corp | 74.181 | 0,00 | 1 | |||||
| 2025-05-09 | 13F | Headlands Technologies LLC | 0 | -100,00 | 0 | |||||
| 2025-07-29 | 13F | Beverly Hills Private Wealth, LLC | 25.799 | -4,88 | 249 | 6,90 | ||||
| 2025-08-13 | 13F | Healthcare Of Ontario Pension Plan Trust Fund | 354.100 | 3.417 | ||||||
| 2025-08-28 | NP | QCSTRX - Stock Account Class R1 | 95.400 | 0,00 | 921 | 12,33 | ||||
| 2025-08-12 | 13F | Pathstone Holdings, LLC | 12.562 | 0,00 | 121 | 13,08 | ||||
| 2025-08-14 | 13F | Lazard Asset Management Llc | 686 | 26,10 | 0 | |||||
| 2025-07-24 | 13F | Ronald Blue Trust, Inc. | 280 | -84,03 | 3 | -86,67 | ||||
| 2025-08-13 | 13F | Invesco Ltd. | 106.017 | -5,88 | 1.023 | 5,79 | ||||
| 2025-08-14 | 13F | UBS Group AG | 378.458 | -38,70 | 3.652 | -31,13 | ||||
| 2025-08-13 | 13F | Arrowstreet Capital, Limited Partnership | 3.247.099 | 282,08 | 31.335 | 329,23 | ||||
| 2025-08-12 | 13F | Personal Cfo Solutions, Llc | 30.668 | 6,97 | 296 | 19,92 | ||||
| 2025-08-01 | 13F | Shilanski & Associates, Inc. | 29.546 | 0,33 | 285 | 13,10 | ||||
| 2025-08-12 | 13F | Jpmorgan Chase & Co | Put | 160.600 | -42,56 | 1.550 | -35,49 | |||
| 2025-07-25 | NP | ECNS - iShares MSCI China Small-Cap ETF | 54.346 | 22,93 | 441 | 37,50 | ||||
| 2025-08-14 | 13F | Symmetry Peak Management Llc | Call | 48.900 | 472 | |||||
| 2025-07-28 | 13F | Allianz Asset Management GmbH | 0 | -100,00 | 0 | |||||
| 2025-08-12 | 13F | Legal & General Group Plc | 11.594 | 0,00 | 112 | 12,12 | ||||
| 2025-08-04 | 13F | Atria Investments Llc | 52.461 | -0,15 | 506 | 12,20 | ||||
| 2025-08-12 | 13F | Jpmorgan Chase & Co | 2.656.227 | 78,09 | 25.633 | 100,08 | ||||
| 2025-08-15 | 13F | Tower Research Capital LLC (TRC) | 32.918 | 96,21 | 318 | 120,14 | ||||
| 2025-08-13 | 13F | Russell Investments Group, Ltd. | 309 | 0,00 | 3 | 0,00 | ||||
| 2025-08-08 | 13F | Cetera Investment Advisers | 50.173 | 2,84 | 484 | 15,51 | ||||
| 2025-08-14 | 13F | Schonfeld Strategic Advisors LLC | 24.337 | 235 | ||||||
| 2025-05-09 | 13F | Belvedere Trading LLC | Put | 0 | -100,00 | 0 | ||||
| 2025-08-14 | 13F | Tudor Investment Corp Et Al | 72.517 | 700 | ||||||
| 2025-05-15 | 13F | Nomura Holdings Inc | 0 | -100,00 | 0 | -100,00 | ||||
| 2025-08-12 | 13F | Nuveen, LLC | 77.100 | -19,18 | 744 | -9,16 | ||||
| 2025-08-14 | 13F | Vident Advisory, LLC | 53.104 | -40,66 | 512 | -33,33 | ||||
| 2025-05-14 | 13F | HAP Trading, LLC | Call | 0 | -100,00 | 0 | -100,00 | |||
| 2025-09-04 | 13F | Abn Amro Investment Solutions | 0 | -100,00 | 0 | -100,00 | ||||
| 2025-08-13 | 13F | EverSource Wealth Advisors, LLC | 2.411 | -18,24 | 23 | -8,00 | ||||
| 2025-08-11 | 13F | Dorsey Wright & Associates | 221.433 | -38,40 | 2.137 | -30,80 | ||||
| 2025-08-28 | NP | GXC - SPDR(R) S&P(R) CHINA ETF | 14.446 | -10,17 | 139 | 0,72 | ||||
| 2025-08-14 | 13F | Millennium Management Llc | 39.195 | -98,37 | 378 | -98,17 | ||||
| 2025-08-18 | 13F/A | National Bank Of Canada /fi/ | 359.120 | 299.166,67 | 3.466 | 346.400,00 | ||||
| 2025-08-01 | 13F | Y-Intercept (Hong Kong) Ltd | 546.479 | 492,32 | 5.274 | 565,78 | ||||
| 2025-07-22 | 13F | IMC-Chicago, LLC | 0 | -100,00 | 0 | -100,00 | ||||
| 2025-08-18 | 13F | Wolverine Trading, Llc | 133.499 | 176,68 | 1.258 | 200,72 | ||||
| 2025-08-13 | 13F | Marshall Wace, Llp | 937.037 | -58,64 | 9.042 | -53,54 | ||||
| 2025-07-30 | NP | APIE - ActivePassive International Equity ETF | 0 | -100,00 | 0 | -100,00 | ||||
| 2025-08-18 | 13F | Wolverine Trading, Llc | Call | 351.800 | -18,77 | 3.314 | -11,75 | |||
| 2025-08-18 | 13F | Wolverine Trading, Llc | Put | 235.200 | 35,64 | 2.216 | 47,37 | |||
| 2025-08-07 | 13F | Connor, Clark & Lunn Investment Management Ltd. | 0 | -100,00 | 0 | |||||
| 2025-08-14 | 13F | Numerai GP LLC | 0 | -100,00 | 0 | |||||
| 2025-08-13 | 13F | Jump Financial, LLC | 1.346.435 | 12.993 | ||||||
| 2025-06-26 | NP | FTIHX - Fidelity Total International Index Fund This fund is a listed as child fund of Fmr Llc and if that institution has disclosed ownership in this security, then these positions will not be double counted when calculating total shares and total value | 52.505 | 32,89 | 433 | 55,76 | ||||
| 2025-08-12 | 13F | BlackRock, Inc. | 2.244.778 | -7,73 | 21.662 | 3,66 | ||||
| 2025-08-14 | 13F | Stifel Financial Corp | 77.314 | 2,30 | 746 | 14,95 | ||||
| 2025-08-14 | 13F | Cubist Systematic Strategies, LLC | Call | 1.013.500 | 71,00 | 9.780 | 92,10 | |||
| 2025-08-13 | 13F | Townsquare Capital Llc | 0 | -100,00 | 0 | |||||
| 2025-08-14 | 13F | Cubist Systematic Strategies, LLC | Put | 19.000 | 183 | |||||
| 2025-08-12 | 13F | Contrarius Group Holdings Ltd | 698.431 | -40,01 | 6.740 | -32,61 | ||||
| 2025-07-15 | 13F | SJS Investment Consulting Inc. | 190 | -25,20 | 2 | -50,00 | ||||
| 2025-07-28 | 13F | BRYN MAWR TRUST Co | 10.000 | 96 | ||||||
| 2025-07-21 | 13F | Mirae Asset Global Investments Co., Ltd. | 3.556 | -0,64 | 34 | 9,68 | ||||
| 2025-07-25 | NP | IEMG - iShares Core MSCI Emerging Markets ETF | 1.043.812 | 15,12 | 8.465 | 28,96 | ||||
| 2025-08-14 | 13F | Federation des caisses Desjardins du Quebec | 205 | 0,00 | 2 | 0,00 | ||||
| 2025-07-25 | NP | EEMS - iShares MSCI Emerging Markets Small-Cap ETF | 31.034 | 14,86 | 252 | 28,72 | ||||
| 2025-08-14 | 13F | Group One Trading, L.p. | Call | 4.185.600 | 45,42 | 40.391 | 63,37 | |||
| 2025-08-14 | 13F | Voloridge Investment Management, Llc | 0 | -100,00 | 0 | |||||
| 2025-08-14 | 13F | Citadel Advisors Llc | Put | 1.988.700 | 9,92 | 19.191 | 23,48 | |||
| 2025-08-14 | 13F | Citadel Advisors Llc | 1.961.751 | 125,89 | 18.931 | 153,75 | ||||
| 2025-08-14 | 13F | Group One Trading, L.p. | 4.390.892 | 80,47 | 42.372 | 102,74 | ||||
| 2025-07-25 | 13F | Cwm, Llc | 256 | 0,00 | 0 | |||||
| 2025-08-19 | 13F | Advisory Services Network, LLC | 12.937 | 127 | ||||||
| 2025-08-28 | NP | SSGVX - State Street Global Equity ex-U.S. Index Portfolio State Street Global All Cap Equity ex-U.S. Index Portfolio This fund is a listed as child fund of State Street Corp and if that institution has disclosed ownership in this security, then these positions will not be double counted when calculating total shares and total value | 42.900 | 0,00 | 414 | 12,23 | ||||
| 2025-08-14 | 13F | Citadel Advisors Llc | Call | 2.157.100 | -7,70 | 20.816 | 3,70 | |||
| 2025-08-12 | 13F | LPL Financial LLC | 91.196 | 10,00 | 880 | 23,60 | ||||
| 2025-08-14 | 13F | Group One Trading, L.p. | Put | 3.491.500 | 64,05 | 33.693 | 84,29 | |||
| 2025-07-29 | 13F | Commons Capital, Llc | 23.000 | 222 | ||||||
| 2025-08-14 | 13F | Mangrove Partners | 79.771 | 770 | ||||||
| 2025-08-14 | 13F | Man Group plc | 748.503 | 532,56 | 7.223 | 610,93 | ||||
| 2025-08-28 | NP | SPGM - SPDR(R) Portfolio MSCI Global Stock Market ETF | 8.502 | 2,94 | 82 | 17,14 | ||||
| 2025-05-13 | 13F | Clear Street Markets Llc | 0 | -100,00 | 0 | -100,00 | ||||
| 2025-08-04 | 13F | AdvisorShares Investments LLC | 154.066 | 27,32 | 1.487 | 41,52 | ||||
| 2025-08-14 | 13F | Scientech Research LLC | 19.319 | 186 | ||||||
| 2025-07-31 | 13F | Caitong International Asset Management Co., Ltd | 5.094 | 205,58 | 49 | 250,00 | ||||
| 2025-08-08 | 13F | Geode Capital Management, Llc | 179.005 | -0,95 | 1.727 | 11,28 | ||||
| 2025-08-15 | 13F | Morgan Stanley | 3.696.042 | 39,23 | 35.667 | 56,42 | ||||
| 2025-08-26 | NP | Profunds - Profund Vp Asia 30 | 54.999 | -7,23 | 531 | 4,13 | ||||
| 2025-05-13 | 13F | Central Asset Investments & Management Holdings (HK) Ltd | 0 | -100,00 | 0 | |||||
| 2025-08-08 | 13F | Police & Firemen's Retirement System of New Jersey | 43.162 | 0,00 | 417 | 12,43 | ||||
| 2025-07-16 | 13F | ORG Wealth Partners, LLC | 606 | 0,00 | 6 | 0,00 | ||||
| 2025-07-18 | 13F | Truist Financial Corp | 16.403 | 0,64 | 158 | 12,86 | ||||
| 2025-05-15 | 13F | Tairen Capital Ltd | 0 | -100,00 | 0 | |||||
| 2025-05-15 | 13F | Two Sigma Securities, Llc | 0 | -100,00 | 0 | |||||
| 2025-08-14 | 13F | Raymond James Financial Inc | 3.400 | 33 | ||||||
| 2025-05-08 | 13F | XTX Topco Ltd | 0 | -100,00 | 0 | |||||
| 2025-08-13 | 13F | Icapital Wealth Llc | 13.049 | 0,00 | 126 | 11,61 | ||||
| 2025-08-08 | 13F | Jupiter Asset Management Ltd | 2.534.300 | 24.456 | ||||||
| 2025-08-13 | 13F | Centiva Capital, LP | 123.383 | 13,41 | 1.191 | 27,41 | ||||
| 2025-08-14 | 13F | Integrated Wealth Concepts LLC | 37.582 | 363 | ||||||
| 2025-07-14 | 13F | GAMMA Investing LLC | 13.168 | 22,74 | 127 | 38,04 | ||||
| 2025-08-14 | 13F | Engineers Gate Manager LP | 0 | -100,00 | 0 | |||||
| 2025-08-13 | 13F | Quadrature Capital Ltd | 57.252 | -20,13 | 553 | -10,24 | ||||
| 2025-08-06 | 13F | Fox Run Management, L.l.c. | 10.662 | 103 | ||||||
| 2025-08-13 | 13F | Walleye Capital LLC | Call | 24.100 | -17,75 | 233 | -7,57 | |||
| 2025-08-14 | 13F | Wells Fargo & Company/mn | 24.824 | 123,22 | 240 | 151,58 | ||||
| 2025-08-14 | 13F | Two Sigma Investments, Lp | 239.480 | -89,17 | 2.311 | -87,84 | ||||
| 2025-07-21 | 13F/A | Point72 Asset Management, L.P. | 0 | -100,00 | 0 | -100,00 | ||||
| 2025-07-31 | 13F | Asset Management One Co., Ltd. | 13.749 | 15,31 | 133 | 29,41 | ||||
| 2025-08-13 | 13F | Walleye Capital LLC | Put | 11.800 | -70,20 | 114 | -66,76 | |||
| 2025-08-13 | 13F | Walleye Capital LLC | 871.831 | -6,29 | 8.413 | 5,28 | ||||
| 2025-08-08 | 13F | Larson Financial Group LLC | 137 | -12,18 | 1 | 0,00 | ||||
| 2025-08-14 | 13F | Alliance Wealth Advisors, LLC /UT | 14.604 | 1,40 | 141 | 13,82 | ||||
| 2025-08-14 | 13F | Ieq Capital, Llc | 12.701 | 0,00 | 123 | 11,93 | ||||
| 2025-07-31 | 13F | Cambridge Investment Research Advisors, Inc. | 65.993 | 1 | ||||||
| 2025-08-28 | NP | GMF - SPDR(R) S&P(R) EMERGING ASIA PACIFIC ETF | 10.261 | -6,52 | 99 | 5,32 | ||||
| 2025-08-01 | 13F | Belvedere Trading LLC | 0 | -100,00 | 0 | |||||
| 2025-08-12 | 13F | Trexquant Investment LP | 675.679 | 6.520 | ||||||
| 2025-05-14 | 13F | Peak6 Llc | 0 | -100,00 | 0 | -100,00 | ||||
| 2025-07-23 | 13F | Shell Asset Management Co | 6.828 | 0,00 | 0 | |||||
| 2025-08-12 | 13F | Proequities, Inc. | Put | 0 | 0 | |||||
| 2025-08-14 | 13F | Two Sigma Advisers, Lp | 166.900 | -80,96 | 1.611 | -78,61 | ||||
| 2025-08-12 | 13F | Proequities, Inc. | Call | 0 | 0 | |||||
| 2025-08-14 | 13F | Wiley Bros.-aintree Capital, Llc | 18.936 | 183 | ||||||
| 2025-08-12 | 13F | Proequities, Inc. | 0 | 0 | ||||||
| 2025-08-14 | 13F | Oasis Management Co Ltd. | 0 | -100,00 | 0 | |||||
| 2025-07-22 | NP | GINN - Goldman Sachs Innovate Equity ETF | 17.869 | -64,31 | 145 | -41,22 | ||||
| 2025-08-07 | 13F | Acadian Asset Management Llc | 32.298 | -74,49 | 0 | -100,00 | ||||
| 2025-08-14 | 13F | Diversify Wealth Management, Llc | 177.706 | 29,08 | 1.795 | 58,20 | ||||
| 2025-07-18 | 13F | Precision Wealth Strategies, LLC | 17.926 | 173 | ||||||
| 2025-08-13 | 13F | Northern Trust Corp | 182.543 | -12,13 | 1.762 | -1,29 | ||||
| 2025-08-14 | 13F | Peak6 Llc | Put | 2.054.300 | 220,58 | 19.824 | 260,16 | |||
| 2025-08-14 | 13F | Peak6 Llc | Call | 1.500.700 | -1,51 | 14.482 | 10,64 | |||
| 2025-08-14 | 13F | State Street Corp | 829.348 | -1,02 | 8.003 | 11,20 | ||||
| 2025-08-14 | 13F | Jane Street Group, Llc | Call | 2.950.900 | 75,21 | 28.476 | 96,83 | |||
| 2025-08-14 | 13F | Goldman Sachs Group Inc | Call | 0 | -100,00 | 0 | -100,00 | |||
| 2025-08-14 | 13F | Jane Street Group, Llc | 5.857.764 | 25,25 | 56.527 | 40,70 | ||||
| 2025-08-14 | 13F | Jane Street Group, Llc | Put | 5.980.000 | 111,02 | 57.707 | 137,07 | |||
| 2025-08-14 | 13F | Qube Research & Technologies Ltd | 460.203 | 4.441 | ||||||
| 2025-07-31 | 13F | Sparta 24 Ltd. | 6.260.946 | 71,20 | 60.418 | 92,33 | ||||
| 2025-08-28 | NP | EWX - SPDR(R) S&P(R) EMERGING MARKETS SMALL CAP ETF | 72.529 | -4,60 | 700 | 7,04 | ||||
| 2025-08-08 | 13F | SBI Securities Co., Ltd. | 6.382 | 22,66 | 62 | 38,64 | ||||
| 2025-08-14 | 13F | Optiver Holding B.V. | 0 | -100,00 | 0 | |||||
| 2025-05-15 | 13F | Barclays Plc | Put | 0 | -100,00 | 0 | -100,00 | |||
| 2025-08-08 | 13F | Quinn Opportunity Partners LLC | 628.921 | 9,28 | 6.069 | 22,78 | ||||
| 2025-08-13 | 13F | CMT Capital Markets Trading GmbH | Call | 60.000 | -34,64 | 1 | ||||
| 2025-08-13 | 13F | CMT Capital Markets Trading GmbH | Put | 12.200 | -97,94 | 0 | -100,00 | |||
| 2025-08-07 | 13F | Profund Advisors Llc | 60.455 | -7,57 | 583 | 3,92 | ||||
| 2025-08-14 | 13F | Diversify Advisory Services, LLC | 54.651 | 42,39 | 552 | 74,37 | ||||
| 2025-08-14 | 13F | Balyasny Asset Management Llc | 245.929 | 2.373 | ||||||
| 2025-07-15 | 13F | Public Employees Retirement System Of Ohio | 19.000 | -11,21 | 183 | 0,00 | ||||
| 2025-08-01 | 13F | Belvedere Trading LLC | Call | 0 | -100,00 | 0 | ||||
| 2025-06-27 | 13F/A | Goldman Sachs Group Inc | Put | 0 | -100,00 | 0 | -100,00 | |||
| 2025-08-06 | 13F | First Horizon Advisors, Inc. | 5.433 | 52 | ||||||
| 2025-07-22 | 13F | IMC-Chicago, LLC | Put | 969.700 | 33,04 | 9.358 | 49,45 | |||
| 2025-07-22 | 13F | IMC-Chicago, LLC | Call | 3.169.300 | 375,94 | 30.584 | 434,67 | |||
| 2025-08-13 | 13F | Quantbot Technologies LP | 72.680 | -29,68 | 701 | -20,97 | ||||
| 2025-08-14 | 13F | CIBC World Markets Inc. | 0 | -100,00 | 0 | |||||
| 2025-08-11 | 13F | Cornerstone Planning Group LLC | 309 | 0,00 | 3 | 50,00 | ||||
| 2025-05-05 | 13F | Hollencrest Capital Management | 0 | -100,00 | 0 | |||||
| 2025-08-13 | 13F | HAP Trading, LLC | Put | 10.200 | 1 |