Statistiche di base
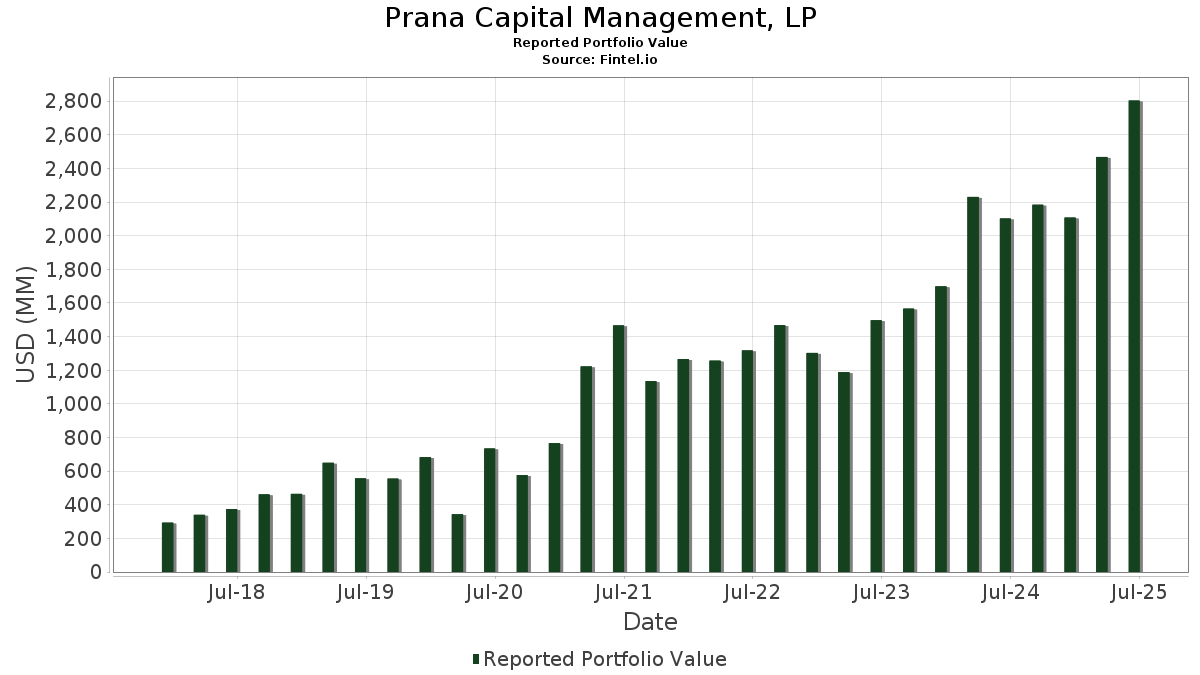
| Valore del portafoglio | $ 2.803.736.318 |
| Posizioni attuali | 106 |
Ultime partecipazioni, performance, AUM (da depositi 13F, 13D)
Prana Capital Management, LP ha dichiarato un totale di 106 partecipazioni negli ultimi documenti depositati presso la SEC. Il valore più recente del portafoglio è pari a $ 2.803.736.318 USD. Il patrimonio gestito effettivo (AUM) corrisponde a questo valore più la liquidità (che non viene dichiarata). Le principali partecipazioni di Prana Capital Management, LP sono BlackRock, Inc. (US:BLK) , Aon plc (US:AON) , Mastercard Incorporated (US:MA) , Bank of America Corporation (US:BAC) , and U.S. Bancorp (US:USB) . Le nuove posizioni di Prana Capital Management, LP includono Nasdaq, Inc. (US:NDAQ) , eToro Group Ltd. (US:ETOR) , Dollar Tree, Inc. (US:DLTR) , First Horizon Corporation (US:FHN) , and EPAM Systems, Inc. (US:EPAM) .
Gli aumenti più importanti di questo trimestre
Utilizziamo la variazione dell'allocazione del portafoglio perché è l'indicatore più significativo. Le variazioni possono essere dovute a transazioni o a variazioni dei prezzi delle azioni.
| Titolo | Azioni (in milioni) |
Valore (in milioni di $) |
Portafoglio % | ΔPortafoglio % |
|---|---|---|---|---|
| 0,70 | 77,67 | 2,7704 | 2,7704 | |
| 0,52 | 184,63 | 6,5850 | 2,5007 | |
| 0,19 | 54,34 | 1,9381 | 1,9381 | |
| 0,51 | 103,34 | 3,6859 | 1,9185 | |
| 2,51 | 108,04 | 3,8535 | 1,5491 | |
| 0,08 | 40,65 | 1,4499 | 1,4499 | |
| 0,33 | 36,92 | 1,3168 | 1,3168 | |
| 0,70 | 33,12 | 1,1814 | 1,1814 | |
| 0,29 | 30,35 | 1,0825 | 1,0825 | |
| 0,33 | 100,37 | 3,5800 | 1,0590 |
Gli aumenti più importanti di questo trimestre
Utilizziamo la variazione dell'allocazione del portafoglio perché è l'indicatore più significativo. Le variazioni possono essere dovute a transazioni o a variazioni dei prezzi delle azioni.
| Titolo | Azioni (in milioni) |
Valore (in milioni di $) |
Portafoglio % | ΔPortafoglio % |
|---|---|---|---|---|
| 0,15 | 19,88 | 0,7090 | -3,8780 | |
| 0,04 | 10,89 | 0,3885 | -2,0258 | |
| 0,48 | 87,84 | 3,1329 | -1,6630 | |
| 0,70 | 63,00 | 2,2469 | -1,4543 | |
| 0,12 | 38,95 | 1,3890 | -1,3118 | |
| 0,68 | 58,19 | 2,0753 | -1,1983 | |
| 0,15 | 29,66 | 1,0578 | -1,0022 | |
| 0,01 | 0,80 | 0,0287 | -0,9170 | |
| 2,83 | 133,90 | 4,7758 | -0,7220 | |
| 0,57 | 47,28 | 1,6863 | -0,6397 |
13F e depositi di fondi
Questo modulo è stato depositato il 2025-08-14 per il periodo di riferimento 2025-06-30. Fai clic sull'icona del link per visualizzare la cronologia completa delle transazioni.
Esegui l'upgrade per sbloccare i dati premium ed esportarli in Excel ![]() .
.
| Titolo | Tipo | Prezzo medio dell'azione | Azioni (in milioni) |
ΔAzioni (%) |
ΔAzioni (%) |
Valore (in milioni di $) |
Portafoglio (%) |
ΔPortafoglio (%) |
|
|---|---|---|---|---|---|---|---|---|---|
| BLK / BlackRock, Inc. | 0,20 | 5,57 | 209,80 | 17,03 | 7,4827 | 0,2203 | |||
| AON / Aon plc | 0,52 | 104,86 | 184,63 | 83,13 | 6,5850 | 2,5007 | |||
| MA / Mastercard Incorporated | 0,28 | 4,57 | 156,29 | 7,21 | 5,5745 | -0,3315 | |||
| BAC / Bank of America Corporation | 2,83 | -12,99 | 133,90 | -1,33 | 4,7758 | -0,7220 | |||
| USB / U.S. Bancorp | 2,49 | 0,07 | 112,67 | 7,25 | 4,0187 | -0,2375 | |||
| TFC / Truist Financial Corporation | 2,51 | 81,81 | 108,04 | 89,95 | 3,8535 | 1,5491 | |||
| ALL / The Allstate Corporation | 0,51 | 143,66 | 103,34 | 136,89 | 3,6859 | 1,9185 | |||
| WTW / Willis Towers Watson Public Limited Company | 0,33 | 77,85 | 100,37 | 61,30 | 3,5800 | 1,0590 | |||
| C / Citigroup Inc. | 1,09 | 13,85 | 92,89 | 36,51 | 3,3132 | 0,5565 | |||
| ICE / Intercontinental Exchange, Inc. | 0,48 | -30,24 | 87,84 | -25,80 | 3,1329 | -1,6630 | |||
| BRO / Brown & Brown, Inc. | 0,70 | 77,67 | 2,7704 | 2,7704 | |||||
| KEY / KeyCorp | 4,06 | 38,20 | 70,79 | 50,56 | 2,5247 | 0,6200 | |||
| CFG / Citizens Financial Group, Inc. | 1,52 | 40,92 | 67,83 | 53,92 | 2,4192 | 0,6340 | |||
| NDAQ / Nasdaq, Inc. | 0,70 | -41,50 | 63,00 | -31,05 | 2,2469 | -1,4543 | |||
| AIG / American International Group, Inc. | 0,68 | -26,86 | 58,19 | -27,99 | 2,0753 | -1,1983 | |||
| CB / Chubb Limited | 0,19 | 54,34 | 1,9381 | 1,9381 | |||||
| SSNC / SS&C Technologies Holdings, Inc. | 0,57 | -4,07 | 47,28 | -17,65 | 1,6863 | -0,6397 | |||
| MS / Morgan Stanley | 0,33 | 15,01 | 46,11 | 38,86 | 1,6446 | 0,2993 | |||
| MCO / Moody's Corporation | 0,08 | 40,65 | 1,4499 | 1,4499 | |||||
| LOW / Lowe's Companies, Inc. | 0,18 | 43,96 | 40,21 | 36,95 | 1,4343 | 0,2447 | |||
| SEIC / SEI Investments Company | 0,44 | 15,19 | 39,74 | 33,34 | 1,4175 | 0,2100 | |||
| AXP / American Express Company | 0,12 | -50,73 | 38,95 | -41,58 | 1,3890 | -1,3118 | |||
| JLL / Jones Lang LaSalle Incorporated | 0,14 | 90,77 | 37,02 | 96,83 | 1,3206 | 0,5585 | |||
| LEN / Lennar Corporation | 0,33 | 36,92 | 1,3168 | 1,3168 | |||||
| SPG / Simon Property Group, Inc. | 0,23 | 27,42 | 36,24 | 23,34 | 1,2924 | 0,1022 | |||
| BAC / Bank of America Corporation | Put | 0,70 | 33,12 | 1,1814 | 1,1814 | ||||
| TOL / Toll Brothers, Inc. | 0,27 | -7,11 | 30,61 | 0,40 | 1,0917 | -0,1434 | |||
| AFL / Aflac Incorporated | 0,29 | 30,35 | 1,0825 | 1,0825 | |||||
| STT / State Street Corporation | 0,28 | -34,31 | 29,73 | -21,98 | 1,0604 | -0,4833 | |||
| RGA / Reinsurance Group of America, Incorporated | 0,15 | -42,10 | 29,66 | -41,68 | 1,0578 | -1,0022 | |||
| BX / Blackstone Inc. | 0,20 | 29,60 | 1,0559 | 1,0559 | |||||
| GPN / Global Payments Inc. | 0,31 | 85,56 | 24,58 | 51,68 | 0,8765 | 0,2201 | |||
| FIS / Fidelity National Information Services, Inc. | 0,29 | -36,14 | 23,46 | -30,38 | 0,8368 | -0,5285 | |||
| GS / The Goldman Sachs Group, Inc. | 0,03 | -31,96 | 22,96 | -11,85 | 0,8188 | -0,2362 | |||
| TRU / TransUnion | 0,25 | 17,96 | 21,92 | 25,08 | 0,7819 | 0,0719 | |||
| NTRS / Northern Trust Corporation | 0,17 | -48,33 | 21,86 | -33,59 | 0,7795 | -0,5536 | |||
| IBKR / Interactive Brokers Group, Inc. | 0,39 | 564,92 | 21,34 | 122,49 | 0,7610 | 0,3725 | |||
| PFG / Principal Financial Group, Inc. | 0,26 | 20,59 | 0,7344 | 0,7344 | |||||
| CTSH / Cognizant Technology Solutions Corporation | 0,26 | 295,85 | 19,96 | 303,82 | 0,7120 | 0,5117 | |||
| SF / Stifel Financial Corp. | 0,19 | 48,80 | 19,92 | 63,84 | 0,7106 | 0,2179 | |||
| KKR / KKR & Co. Inc. | 0,15 | -84,74 | 19,88 | -82,44 | 0,7090 | -3,8780 | |||
| BJ / BJ's Wholesale Club Holdings, Inc. | 0,18 | 157,19 | 19,61 | 143,08 | 0,6996 | 0,3727 | |||
| OWL / Blue Owl Capital Inc. | 0,95 | 18,31 | 0,6530 | 0,6530 | |||||
| CG / The Carlyle Group Inc. | 0,34 | 17,37 | 0,6196 | 0,6196 | |||||
| SPGI / S&P Global Inc. | 0,03 | -40,70 | 17,06 | -38,46 | 0,6086 | -0,5146 | |||
| IT / Gartner, Inc. | 0,04 | 614,50 | 16,63 | 588,33 | 0,5931 | 0,4952 | |||
| WM / Waste Management, Inc. | 0,07 | -21,43 | 15,30 | -22,34 | 0,5458 | -0,2525 | |||
| PRI / Primerica, Inc. | 0,05 | 78,43 | 14,91 | 71,62 | 0,5318 | 0,1798 | |||
| MSCI / MSCI Inc. | 0,03 | -19,85 | 14,75 | -18,26 | 0,5261 | -0,2050 | |||
| EG / Everest Group, Ltd. | 0,04 | 180,36 | 12,84 | 162,23 | 0,4580 | 0,2596 | |||
| PLD / Prologis, Inc. | 0,12 | 12,18 | 0,4344 | 0,4344 | |||||
| FNF / Fidelity National Financial, Inc. | 0,21 | 12,05 | 0,4298 | 0,4298 | |||||
| ACN / Accenture plc | 0,04 | -80,92 | 10,89 | -81,72 | 0,3885 | -2,0258 | |||
| XYZ / Block, Inc. | 0,15 | -22,08 | 10,44 | -2,57 | 0,3722 | -0,0617 | |||
| AIZ / Assurant, Inc. | 0,05 | 10,17 | 0,3627 | 0,3627 | |||||
| INVH / Invitation Homes Inc. | 0,28 | 9,29 | 0,3313 | 0,3313 | |||||
| NDAQ / Nasdaq, Inc. | Put | 0,10 | 8,94 | 0,3189 | 0,3189 | ||||
| BEN / Franklin Resources, Inc. | 0,37 | 8,71 | 0,3105 | 0,3105 | |||||
| CSGP / CoStar Group, Inc. | 0,10 | -18,36 | 7,91 | -17,16 | 0,2822 | -0,1047 | |||
| EVR / Evercore Inc. | 0,03 | 7,90 | 0,2816 | 0,2816 | |||||
| UNH / UnitedHealth Group Incorporated | 0,02 | 135,57 | 7,72 | 40,33 | 0,2752 | 0,0524 | |||
| MKL / Markel Group Inc. | 0,00 | -38,89 | 7,15 | -34,72 | 0,2550 | -0,1887 | |||
| MKTX / MarketAxess Holdings Inc. | 0,03 | -30,61 | 6,88 | -28,37 | 0,2455 | -0,1438 | |||
| EQH / Equitable Holdings, Inc. | 0,12 | 6,51 | 0,2323 | 0,2323 | |||||
| AFG / American Financial Group, Inc. | 0,05 | 17,41 | 5,86 | 12,83 | 0,2089 | -0,0014 | |||
| FCNCA / First Citizens BancShares, Inc. | 0,00 | -41,70 | 5,53 | -38,49 | 0,1973 | -0,1670 | |||
| TGT / Target Corporation | 0,05 | -61,38 | 4,88 | -63,50 | 0,1740 | -0,3673 | |||
| JEF / Jefferies Financial Group Inc. | 0,07 | 3,98 | 0,1420 | 0,1420 | |||||
| PAYX / Paychex, Inc. | 0,03 | 3,87 | 0,1379 | 0,1379 | |||||
| RKT / Rocket Companies, Inc. | 0,27 | 3,93 | 3,81 | 22,09 | 0,1361 | 0,0095 | |||
| GFL / GFL Environmental Inc. | 0,08 | 98,08 | 3,79 | 106,93 | 0,1353 | 0,0610 | |||
| ORCL / Oracle Corporation | 0,02 | -74,28 | 3,60 | -59,80 | 0,1283 | -0,2341 | |||
| NSP / Insperity, Inc. | 0,06 | 3,50 | 0,1248 | 0,1248 | |||||
| STEP / StepStone Group Inc. | 0,06 | 83,21 | 3,09 | 94,77 | 0,1102 | 0,0459 | |||
| IVZ / Invesco Ltd. | 0,19 | 3,00 | 0,1069 | 0,1069 | |||||
| COIN / Coinbase Global, Inc. | 0,01 | 2,86 | 0,1021 | 0,1021 | |||||
| INTU / Intuit Inc. | 0,00 | -86,45 | 2,72 | -82,61 | 0,0971 | -0,5373 | |||
| CPRT / Copart, Inc. | 0,05 | 27,32 | 2,62 | 10,38 | 0,0934 | -0,0027 | |||
| BGC / BGC Group, Inc. | 0,25 | 10,54 | 2,55 | 23,32 | 0,0911 | 0,0072 | |||
| ALLY / Ally Financial Inc. | 0,06 | 2,51 | 0,0895 | 0,0895 | |||||
| CNC / Centene Corporation | 0,04 | 9,63 | 2,25 | -2,00 | 0,0803 | -0,0128 | |||
| ELV / Elevance Health, Inc. | 0,01 | 61,30 | 2,23 | 44,32 | 0,0797 | 0,0169 | |||
| JHG / Janus Henderson Group plc | 0,05 | -56,03 | 1,75 | -52,77 | 0,0624 | -0,0876 | |||
| UHS / Universal Health Services, Inc. | 0,01 | 1,68 | 0,0599 | 0,0599 | |||||
| IRM / Iron Mountain Incorporated | 0,02 | 21,97 | 1,63 | 45,49 | 0,0581 | 0,0127 | |||
| WCN / Waste Connections, Inc. | 0,01 | 1,62 | 0,0579 | 0,0579 | |||||
| HLI / Houlihan Lokey, Inc. | 0,01 | -74,28 | 1,59 | -71,36 | 0,0567 | -0,1680 | |||
| FI / Fiserv, Inc. | 0,01 | 1,58 | 0,0563 | 0,0563 | |||||
| LPLA / LPL Financial Holdings Inc. | 0,00 | 1,57 | 0,0561 | 0,0561 | |||||
| BAM / Brookfield Asset Management Ltd. | 0,02 | -56,11 | 1,36 | -49,93 | 0,0485 | -0,0615 | |||
| ETOR / eToro Group Ltd. | 0,02 | 1,34 | 0,0478 | 0,0478 | |||||
| RNR / RenaissanceRe Holdings Ltd. | 0,00 | 1,03 | 0,0366 | 0,0366 | |||||
| UNP / Union Pacific Corporation | 0,00 | 1,02 | 0,0364 | 0,0364 | |||||
| BR / Broadridge Financial Solutions, Inc. | 0,00 | -90,61 | 1,01 | -90,59 | 0,0361 | -0,3997 | |||
| VIRT / Virtu Financial, Inc. | 0,02 | -63,24 | 0,86 | -56,81 | 0,0305 | -0,0498 | |||
| PYPL / PayPal Holdings, Inc. | 0,01 | 0,84 | 0,0299 | 0,0299 | |||||
| MQ / Marqeta, Inc. | 0,14 | 433,19 | 0,81 | 659,43 | 0,0287 | 0,0244 | |||
| WMT / Walmart Inc. | 0,01 | -96,91 | 0,80 | -96,56 | 0,0287 | -0,9170 | |||
| DLTR / Dollar Tree, Inc. | 0,01 | 0,70 | 0,0249 | 0,0249 | |||||
| COF / Capital One Financial Corporation | 0,00 | 0,55 | 0,0196 | 0,0196 | |||||
| FOUR / Shift4 Payments, Inc. | 0,00 | -91,00 | 0,34 | -89,09 | 0,0122 | -0,1145 | |||
| FHN / First Horizon Corporation | 0,01 | 0,28 | 0,0099 | 0,0099 | |||||
| EPAM / EPAM Systems, Inc. | 0,00 | 0,27 | 0,0097 | 0,0097 | |||||
| ZION / Zions Bancorporation, National Association | 0,00 | 0,25 | 0,0089 | 0,0089 | |||||
| UWMC / UWM Holdings Corporation | 0,05 | 0,21 | 0,0076 | 0,0076 | |||||
| WBS / Webster Financial Corporation | 0,00 | 0,21 | 0,0075 | 0,0075 | |||||
| SCHW / The Charles Schwab Corporation | 0,00 | -100,00 | 0,00 | 0,0000 | |||||
| CINF / Cincinnati Financial Corporation | 0,00 | -100,00 | 0,00 | 0,0000 | |||||
| UNM / Unum Group | 0,00 | -100,00 | 0,00 | 0,0000 | |||||
| FDS / FactSet Research Systems Inc. | 0,00 | -100,00 | 0,00 | 0,0000 | |||||
| HCA / HCA Healthcare, Inc. | 0,00 | -100,00 | 0,00 | 0,0000 | |||||
| FTDR / Frontdoor, Inc. | 0,00 | -100,00 | 0,00 | 0,0000 | |||||
| DHI / D.R. Horton, Inc. | 0,00 | -100,00 | 0,00 | 0,0000 | |||||
| MKTX / MarketAxess Holdings Inc. | Put | 0,00 | -100,00 | 0,00 | -100,00 | -0,0438 | |||
| GPN / Global Payments Inc. | Call | 0,00 | -100,00 | 0,00 | -100,00 | -0,1789 | |||
| CBOE / Cboe Global Markets, Inc. | 0,00 | -100,00 | 0,00 | 0,0000 | |||||
| ADP / Automatic Data Processing, Inc. | 0,00 | -100,00 | 0,00 | 0,0000 | |||||
| HBAN / Huntington Bancshares Incorporated | 0,00 | -100,00 | 0,00 | 0,0000 | |||||
| RF / Regions Financial Corporation | 0,00 | -100,00 | 0,00 | 0,0000 | |||||
| CG / The Carlyle Group Inc. | Call | 0,00 | -100,00 | 0,00 | -100,00 | -0,2119 | |||
| LAZ / Lazard, Inc. | 0,00 | -100,00 | 0,00 | 0,0000 | |||||
| ARMK / Aramark | 0,00 | -100,00 | 0,00 | 0,0000 | |||||
| WEX / WEX Inc. | 0,00 | -100,00 | 0,00 | 0,0000 | |||||
| ADBE / Adobe Inc. | 0,00 | -100,00 | 0,00 | 0,0000 | |||||
| GLOB / Globant S.A. | 0,00 | -100,00 | 0,00 | 0,0000 | |||||
| TPG / TPG Inc. | 0,00 | -100,00 | 0,00 | 0,0000 | |||||
| RYAN / Ryan Specialty Holdings, Inc. | 0,00 | -100,00 | 0,00 | 0,0000 | |||||
| ECL / Ecolab Inc. | 0,00 | -100,00 | 0,00 | 0,0000 | |||||
| HOOD / Robinhood Markets, Inc. | 0,00 | -100,00 | 0,00 | 0,0000 | |||||
| CSX / CSX Corporation | 0,00 | -100,00 | 0,00 | 0,0000 | |||||
| CRM / Salesforce, Inc. | 0,00 | -100,00 | 0,00 | 0,0000 | |||||
| BILL / BILL Holdings, Inc. | 0,00 | -100,00 | 0,00 | 0,0000 | |||||
| VOYA / Voya Financial, Inc. | 0,00 | -100,00 | 0,00 | 0,0000 | |||||
| CPAY / Corpay, Inc. | 0,00 | -100,00 | 0,00 | 0,0000 | |||||
| ARES / Ares Management Corporation | 0,00 | -100,00 | 0,00 | 0,0000 |