Statistiche di base
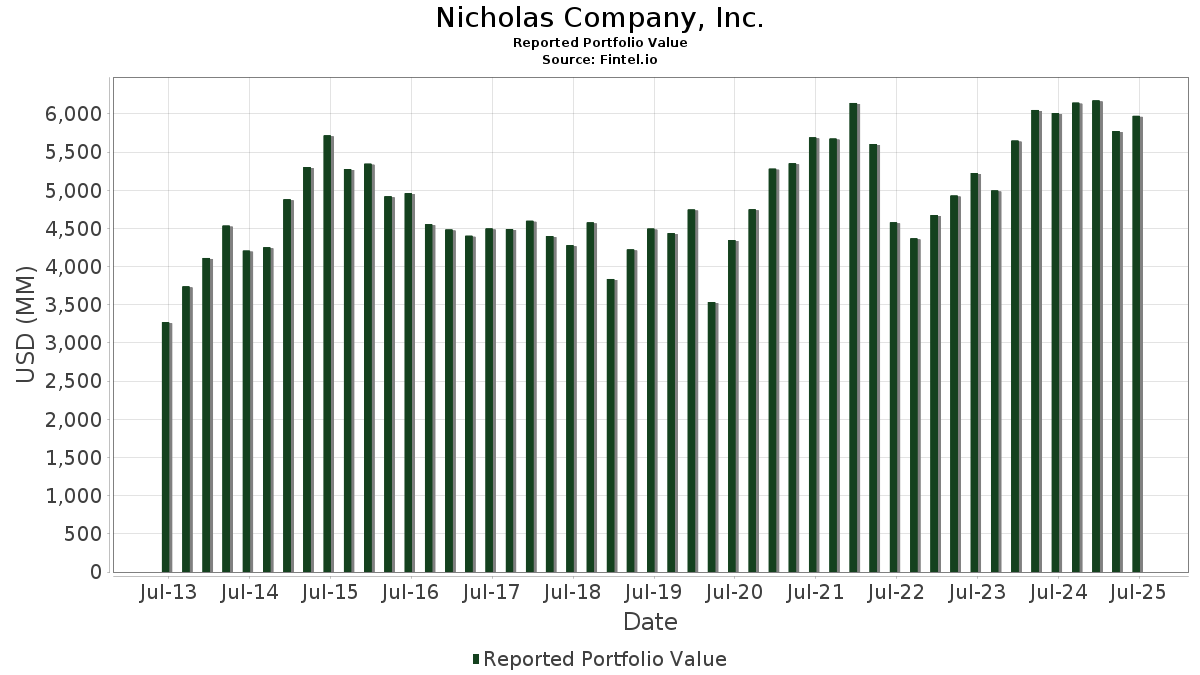
| Valore del portafoglio | $ 5.974.016.094 |
| Posizioni attuali | 216 |
Ultime partecipazioni, performance, AUM (da depositi 13F, 13D)
Nicholas Company, Inc. ha dichiarato un totale di 216 partecipazioni negli ultimi documenti depositati presso la SEC. Il valore più recente del portafoglio è pari a $ 5.974.016.094 USD. Il patrimonio gestito effettivo (AUM) corrisponde a questo valore più la liquidità (che non viene dichiarata). Le principali partecipazioni di Nicholas Company, Inc. sono Microsoft Corporation (US:MSFT) , Alphabet Inc. (US:GOOG) , Amazon.com, Inc. (US:AMZN) , NVIDIA Corporation (US:NVDA) , and Apple Inc. (US:AAPL) . Le nuove posizioni di Nicholas Company, Inc. includono Carrier Global Corporation (US:CARR) , Ralliant Corporation (US:RAL) , Hilton Worldwide Holdings Inc. (US:HLT) , Alkami Technology, Inc. (US:ALKT) , and SPX Technologies, Inc. (US:SPXC) .
Gli aumenti più importanti di questo trimestre
Utilizziamo la variazione dell'allocazione del portafoglio perché è l'indicatore più significativo. Le variazioni possono essere dovute a transazioni o a variazioni dei prezzi delle azioni.
| Titolo | Azioni (in milioni) |
Valore (in milioni di $) |
Portafoglio % | ΔPortafoglio % |
|---|---|---|---|---|
| 0,10 | 73,84 | 1,2360 | 1,2360 | |
| 0,92 | 67,50 | 1,1298 | 1,1298 | |
| 1,16 | 182,99 | 3,0631 | 1,0675 | |
| 0,26 | 82,50 | 1,3809 | 0,7385 | |
| 0,46 | 229,32 | 3,8387 | 0,6095 | |
| 0,05 | 62,31 | 1,0430 | 0,4360 | |
| 0,33 | 74,62 | 1,2491 | 0,4142 | |
| 0,85 | 187,48 | 3,1383 | 0,3233 | |
| 1,09 | 193,08 | 3,2321 | 0,2873 | |
| 0,30 | 14,46 | 0,2420 | 0,2420 |
Gli aumenti più importanti di questo trimestre
Utilizziamo la variazione dell'allocazione del portafoglio perché è l'indicatore più significativo. Le variazioni possono essere dovute a transazioni o a variazioni dei prezzi delle azioni.
| Titolo | Azioni (in milioni) |
Valore (in milioni di $) |
Portafoglio % | ΔPortafoglio % |
|---|---|---|---|---|
| 0,06 | 4,74 | 0,0794 | -0,9452 | |
| 0,11 | 35,14 | 0,5882 | -0,7285 | |
| 0,04 | 8,83 | 0,1478 | -0,6901 | |
| 0,09 | 5,98 | 0,1001 | -0,6474 | |
| 0,12 | 70,03 | 1,1722 | -0,4630 | |
| 0,48 | 83,40 | 1,3961 | -0,4531 | |
| 0,20 | 69,66 | 1,1661 | -0,4495 | |
| 0,89 | 46,63 | 0,7806 | -0,3530 | |
| 0,18 | 64,73 | 1,0835 | -0,2834 | |
| 1,47 | 61,94 | 1,0368 | -0,2571 |
13F e depositi di fondi
Questo modulo è stato depositato il 2025-08-05 per il periodo di riferimento 2025-06-30. Fai clic sull'icona del link per visualizzare la cronologia completa delle transazioni.
Esegui l'upgrade per sbloccare i dati premium ed esportarli in Excel ![]() .
.
| Titolo | Tipo | Prezzo medio dell'azione | Azioni (in milioni) |
ΔAzioni (%) |
ΔAzioni (%) |
Valore (in milioni di $) |
Portafoglio (%) |
ΔPortafoglio (%) |
|
|---|---|---|---|---|---|---|---|---|---|
| MSFT / Microsoft Corporation | 0,46 | -7,19 | 229,32 | 22,98 | 3,8387 | 0,6095 | |||
| GOOG / Alphabet Inc. | 1,09 | 0,00 | 193,08 | 13,54 | 3,2321 | 0,2873 | |||
| AMZN / Amazon.com, Inc. | 0,85 | 0,02 | 187,48 | 15,33 | 3,1383 | 0,3233 | |||
| NVDA / NVIDIA Corporation | 1,16 | 8,93 | 182,99 | 58,79 | 3,0631 | 1,0675 | |||
| AAPL / Apple Inc. | 0,59 | 0,00 | 120,31 | -7,64 | 2,0140 | -0,2417 | |||
| ORLY / O'Reilly Automotive, Inc. | 1,08 | 1.399,90 | 97,22 | -5,63 | 1,6273 | -0,1567 | |||
| TJX / The TJX Companies, Inc. | 0,74 | -0,90 | 91,69 | 0,48 | 1,5349 | -0,0454 | |||
| HD / The Home Depot, Inc. | 0,24 | 0,00 | 87,88 | 0,04 | 1,4710 | -0,0501 | |||
| COST / Costco Wholesale Corporation | 0,09 | 0,00 | 87,39 | 4,67 | 1,4628 | 0,0170 | |||
| SPGI / S&P Global Inc. | 0,17 | 0,00 | 87,27 | 3,78 | 1,4609 | 0,0046 | |||
| XPRO / Expro Group Holdings N.V. | 0,48 | 0,04 | 83,40 | -21,90 | 1,3961 | -0,4531 | |||
| ZS / Zscaler, Inc. | 0,26 | 40,54 | 82,50 | 122,37 | 1,3809 | 0,7385 | |||
| AZN / AstraZeneca PLC - Depositary Receipt (Common Stock) | 1,14 | -1,84 | 79,64 | -6,68 | 1,3330 | -0,1447 | |||
| CMG / Chipotle Mexican Grill, Inc. | 1,37 | -0,00 | 76,98 | 11,83 | 1,2885 | 0,0965 | |||
| NOW / ServiceNow, Inc. | 0,07 | -14,11 | 75,52 | 10,92 | 1,2642 | 0,0851 | |||
| SNOW / Snowflake Inc. | 0,33 | 1,09 | 74,62 | 54,77 | 1,2491 | 0,4142 | |||
| CRM / Salesforce, Inc. | 0,27 | 0,00 | 74,03 | 1,61 | 1,2392 | -0,0224 | |||
| META / Meta Platforms, Inc. | 0,10 | 73,84 | 1,2360 | 1,2360 | |||||
| ACN / Accenture plc | 0,25 | 14,69 | 73,37 | 9,85 | 1,2282 | 0,0716 | |||
| ICE / Intercontinental Exchange, Inc. | 0,40 | 0,00 | 72,80 | 6,36 | 1,2186 | 0,0333 | |||
| JPM / JPMorgan Chase & Co. | 0,25 | -3,21 | 72,53 | 14,39 | 1,2141 | 0,1162 | |||
| AMD / Advanced Micro Devices, Inc. | 0,51 | -10,21 | 72,25 | 24,01 | 1,2094 | 0,2005 | |||
| VMC / Vulcan Materials Company | 0,28 | -0,01 | 71,98 | 11,79 | 1,2049 | 0,0899 | |||
| LLY / Eli Lilly and Company | 0,09 | 9,44 | 71,73 | 3,30 | 1,2007 | -0,0018 | |||
| MA / Mastercard Incorporated | 0,12 | -27,67 | 70,03 | -25,84 | 1,1722 | -0,4630 | |||
| SHW / The Sherwin-Williams Company | 0,20 | 0,00 | 69,76 | -1,67 | 1,1677 | -0,0608 | |||
| V / Visa Inc. | 0,20 | -26,30 | 69,66 | -25,33 | 1,1661 | -0,4495 | |||
| WDAY / Workday, Inc. | 0,28 | 0,02 | 67,69 | 2,79 | 1,1330 | -0,0072 | |||
| SNY / Sanofi - Depositary Receipt (Common Stock) | 1,40 | 10,02 | 67,50 | -4,17 | 1,1299 | -0,0898 | |||
| CARR / Carrier Global Corporation | 0,92 | 67,50 | 1,1298 | 1,1298 | |||||
| BSX / Boston Scientific Corporation | 0,63 | 0,00 | 67,36 | 6,47 | 1,1276 | 0,0320 | |||
| SYK / Stryker Corporation | 0,16 | 0,00 | 65,15 | 6,28 | 1,0906 | 0,0290 | |||
| TTD / The Trade Desk, Inc. | 0,90 | 0,00 | 64,83 | 31,56 | 1,0852 | 0,2319 | |||
| AON / Aon plc | 0,18 | -8,27 | 64,73 | -18,00 | 1,0835 | -0,2834 | |||
| WCN / Waste Connections, Inc. | 0,35 | -5,17 | 64,42 | -9,28 | 1,0784 | -0,1514 | |||
| ADBE / Adobe Inc. | 0,16 | -6,16 | 62,76 | -5,34 | 1,0506 | -0,0976 | |||
| NFLX / Netflix, Inc. | 0,05 | 23,78 | 62,31 | 77,76 | 1,0430 | 0,4360 | |||
| FAST / Fastenal Company | 1,47 | 53,06 | 61,94 | -17,10 | 1,0368 | -0,2571 | |||
| CTAS / Cintas Corporation | 0,27 | 0,00 | 60,30 | 8,44 | 1,0094 | 0,0464 | |||
| SBUX / Starbucks Corporation | 0,66 | 17,83 | 60,14 | 10,07 | 1,0067 | 0,0605 | |||
| TXN / Texas Instruments Incorporated | 0,29 | 0,00 | 60,09 | 15,54 | 1,0059 | 0,1052 | |||
| KVUE / Kenvue Inc. | 2,62 | -0,01 | 54,91 | -12,73 | 0,9192 | -0,1704 | |||
| TMO / Thermo Fisher Scientific Inc. | 0,13 | 0,00 | 54,73 | -18,52 | 0,9161 | -0,2470 | |||
| PANW / Palo Alto Networks, Inc. | 0,27 | -6,23 | 54,66 | 12,46 | 0,9150 | 0,0733 | |||
| SNPS / Synopsys, Inc. | 0,11 | 0,05 | 54,57 | 19,60 | 0,9135 | 0,1234 | |||
| ALC / Alcon Inc. | 0,61 | 0,00 | 53,65 | -7,00 | 0,8981 | -0,1010 | |||
| MCD / McDonald's Corporation | 0,18 | 0,00 | 52,25 | -6,47 | 0,8747 | -0,0927 | |||
| KO / The Coca-Cola Company | 0,74 | 0,00 | 52,15 | -1,22 | 0,8729 | -0,0412 | |||
| FTV / Fortive Corporation | 0,89 | -0,00 | 46,63 | -28,77 | 0,7806 | -0,3530 | |||
| TEAM / Atlassian Corporation | 0,23 | 9,96 | 46,26 | 5,23 | 0,7744 | 0,0131 | |||
| FTXP / Foothills Exploration, Inc. | 0,05 | 0,00 | 45,80 | 31,77 | 0,7667 | 0,1648 | |||
| ROP / Roper Technologies, Inc. | 0,08 | 0,00 | 45,56 | -3,86 | 0,7626 | -0,0580 | |||
| CDNS / Cadence Design Systems, Inc. | 0,15 | -8,43 | 45,51 | 10,96 | 0,7619 | 0,0515 | |||
| LRCX / Lam Research Corporation | 0,44 | 0,00 | 43,08 | 33,89 | 0,7211 | 0,1639 | |||
| ITW / Illinois Tool Works Inc. | 0,17 | 0,03 | 42,47 | -0,27 | 0,7110 | -0,0265 | |||
| CYBR / CyberArk Software Ltd. | 0,10 | -12,44 | 39,90 | 5,40 | 0,6680 | 0,0123 | |||
| UNH / UnitedHealth Group Incorporated | 0,11 | -22,42 | 35,14 | -53,79 | 0,5882 | -0,7285 | |||
| MCHP / Microchip Technology Incorporated | 0,38 | -2,75 | 26,70 | 41,37 | 0,4469 | 0,1199 | |||
| PCTY / Paylocity Holding Corporation | 0,14 | 0,01 | 26,02 | -3,27 | 0,4356 | -0,0303 | |||
| AOS / A. O. Smith Corporation | 0,39 | 0,01 | 25,63 | 0,32 | 0,4291 | -0,0134 | |||
| RJF / Raymond James Financial, Inc. | 0,16 | -0,03 | 24,78 | 10,37 | 0,4148 | 0,0260 | |||
| DT / Dynatrace, Inc. | 0,44 | -0,01 | 24,49 | 17,09 | 0,4100 | 0,0478 | |||
| WING / Wingstop Inc. | 0,07 | 12,34 | 23,78 | 67,69 | 0,3980 | 0,1525 | |||
| RBA / RB Global, Inc. | 0,22 | -14,15 | 23,68 | -9,11 | 0,3964 | -0,0548 | |||
| CPAY / Corpay, Inc. | 0,07 | 0,00 | 23,56 | -4,85 | 0,3943 | -0,0344 | |||
| VRSK / Verisk Analytics, Inc. | 0,07 | -6,50 | 23,18 | -2,14 | 0,3880 | -0,0222 | |||
| TDY / Teledyne Technologies Incorporated | 0,04 | -3,11 | 22,66 | -0,26 | 0,3794 | -0,0141 | |||
| TRU / TransUnion | 0,26 | -0,02 | 22,45 | 6,02 | 0,3758 | 0,0091 | |||
| CBRE / CBRE Group, Inc. | 0,16 | -0,01 | 22,43 | 7,14 | 0,3755 | 0,0129 | |||
| BJ / BJ's Wholesale Club Holdings, Inc. | 0,20 | -6,34 | 21,99 | -11,48 | 0,3681 | -0,0621 | |||
| ATR / AptarGroup, Inc. | 0,14 | 0,01 | 21,88 | 5,44 | 0,3662 | 0,0069 | |||
| GMED / Globus Medical, Inc. | 0,36 | 0,02 | 21,25 | -19,35 | 0,3558 | -0,1006 | |||
| LHX / L3Harris Technologies, Inc. | 0,08 | -0,01 | 21,05 | 19,83 | 0,3523 | 0,0482 | |||
| PTC / PTC Inc. | 0,12 | 0,02 | 20,76 | 11,25 | 0,3475 | 0,0244 | |||
| AME / AMETEK, Inc. | 0,11 | -0,02 | 20,70 | 5,10 | 0,3466 | 0,0054 | |||
| VEEV / Veeva Systems Inc. | 0,07 | 0,04 | 20,24 | 24,38 | 0,3389 | 0,0570 | |||
| RMD / ResMed Inc. | 0,08 | -0,01 | 20,22 | 15,24 | 0,3385 | 0,0346 | |||
| BR / Broadridge Financial Solutions, Inc. | 0,08 | -0,04 | 19,81 | 0,20 | 0,3316 | -0,0108 | |||
| NDSN / Nordson Corporation | 0,09 | 13,41 | 19,08 | 20,53 | 0,3193 | 0,0452 | |||
| LSCC / Lattice Semiconductor Corporation | 0,39 | 0,01 | 18,96 | -6,59 | 0,3174 | -0,0341 | |||
| WAB / Westinghouse Air Brake Technologies Corporation | 0,09 | -0,02 | 18,30 | 15,41 | 0,3063 | 0,0317 | |||
| STVN / Stevanato Group S.p.A. | 0,75 | 0,00 | 18,22 | 19,64 | 0,3049 | 0,0413 | |||
| IEX / IDEX Corporation | 0,10 | 19,37 | 18,18 | 15,80 | 0,3043 | 0,0325 | |||
| SCI / Service Corporation International | 0,22 | -0,04 | 18,04 | 1,46 | 0,3019 | -0,0059 | |||
| FOUR / Shift4 Payments, Inc. | 0,18 | 0,79 | 17,89 | 22,26 | 0,2995 | 0,0461 | |||
| MTD / Mettler-Toledo International Inc. | 0,02 | 0,00 | 17,79 | -0,53 | 0,2978 | -0,0119 | |||
| MORN / Morningstar, Inc. | 0,06 | -0,04 | 17,76 | 4,65 | 0,2972 | 0,0034 | |||
| CDW / CDW Corporation | 0,10 | -0,03 | 17,75 | 11,41 | 0,2971 | 0,0212 | |||
| STE / STERIS plc | 0,07 | 0,00 | 17,70 | 5,99 | 0,2963 | 0,0071 | |||
| MNDY / monday.com Ltd. | 0,06 | 26,71 | 17,69 | 63,88 | 0,2962 | 0,1092 | |||
| ULTA / Ulta Beauty, Inc. | 0,04 | -0,03 | 17,40 | 27,60 | 0,2912 | 0,0551 | |||
| OKTA / Okta, Inc. | 0,17 | 0,00 | 17,24 | -4,99 | 0,2886 | -0,0256 | |||
| CSGP / CoStar Group, Inc. | 0,21 | -0,06 | 17,23 | 1,42 | 0,2884 | -0,0058 | |||
| ESTC / Elastic N.V. | 0,20 | 0,00 | 17,03 | -5,35 | 0,2851 | -0,0265 | |||
| IT / Gartner, Inc. | 0,04 | -5,55 | 16,45 | -9,04 | 0,2753 | -0,0378 | |||
| ODFL / Old Dominion Freight Line, Inc. | 0,10 | -0,02 | 15,51 | -1,92 | 0,2596 | -0,0142 | |||
| DPZ / Domino's Pizza, Inc. | 0,03 | -0,02 | 14,99 | -1,94 | 0,2510 | -0,0138 | |||
| RAL / Ralliant Corporation | 0,30 | 14,46 | 0,2420 | 0,2420 | |||||
| RSG / Republic Services, Inc. | 0,06 | -15,67 | 13,82 | -14,13 | 0,2313 | -0,0473 | |||
| TECH / Bio-Techne Corporation | 0,26 | -0,01 | 13,31 | -12,25 | 0,2228 | -0,0399 | |||
| QTWO / Q2 Holdings, Inc. | 0,14 | 0,04 | 12,80 | 17,02 | 0,2143 | 0,0248 | |||
| ADI / Analog Devices, Inc. | 0,05 | 0,00 | 12,63 | 18,02 | 0,2115 | 0,0261 | |||
| NTRS / Northern Trust Corporation | 0,10 | -14,80 | 12,54 | 9,51 | 0,2099 | 0,0116 | |||
| CNS / Cohen & Steers, Inc. | 0,16 | 0,00 | 12,41 | -6,11 | 0,2077 | -0,0211 | |||
| AVGO / Broadcom Inc. | 0,04 | -15,89 | 12,23 | 38,48 | 0,2048 | 0,0518 | |||
| COO / The Cooper Companies, Inc. | 0,17 | 0,03 | 12,17 | -15,61 | 0,2037 | -0,0460 | |||
| ABT / Abbott Laboratories | 0,09 | -3,56 | 12,11 | -1,11 | 0,2027 | -0,0094 | |||
| PBH / Prestige Consumer Healthcare Inc. | 0,15 | -0,01 | 12,10 | -7,13 | 0,2026 | -0,0231 | |||
| IQV / IQVIA Holdings Inc. | 0,08 | -0,02 | 11,94 | -10,63 | 0,1998 | -0,0315 | |||
| RVTY / Revvity, Inc. | 0,12 | -0,01 | 11,60 | -8,59 | 0,1941 | -0,0256 | |||
| SCHW / The Charles Schwab Corporation | 0,13 | -7,31 | 11,56 | 8,04 | 0,1936 | 0,0082 | |||
| CVX / Chevron Corporation | 0,08 | -0,01 | 11,46 | -14,41 | 0,1918 | -0,0400 | |||
| CMS / CMS Energy Corporation | 0,16 | -3,42 | 11,21 | -10,92 | 0,1877 | -0,0303 | |||
| BURL / Burlington Stores, Inc. | 0,05 | -0,01 | 10,85 | -2,39 | 0,1816 | -0,0109 | |||
| ORCL / Oracle Corporation | 0,05 | -18,06 | 10,70 | 28,14 | 0,1791 | 0,0345 | |||
| HLT / Hilton Worldwide Holdings Inc. | 0,04 | 10,65 | 0,1783 | 0,1783 | |||||
| DORM / Dorman Products, Inc. | 0,08 | 0,00 | 10,40 | 1,77 | 0,1741 | -0,0029 | |||
| EHC / Encompass Health Corporation | 0,08 | 0,00 | 10,40 | 21,08 | 0,1740 | 0,0253 | |||
| DSGX / The Descartes Systems Group Inc. | 0,10 | 0,02 | 10,31 | 0,83 | 0,1725 | -0,0045 | |||
| EXLS / ExlService Holdings, Inc. | 0,23 | -0,05 | 10,02 | -7,29 | 0,1677 | -0,0194 | |||
| CRWD / CrowdStrike Holdings, Inc. | 0,02 | -34,91 | 9,98 | -5,97 | 0,1671 | -0,0167 | |||
| JKHY / Jack Henry & Associates, Inc. | 0,06 | -0,15 | 9,95 | -1,49 | 0,1665 | -0,0083 | |||
| HOLX / Hologic, Inc. | 0,15 | 0,00 | 9,91 | 5,49 | 0,1659 | 0,0032 | |||
| PNC / The PNC Financial Services Group, Inc. | 0,05 | 0,00 | 9,87 | 6,05 | 0,1652 | 0,0041 | |||
| KAR / OPENLANE, Inc. | 0,40 | -7,18 | 9,87 | 17,72 | 0,1652 | 0,0200 | |||
| IIIV / i3 Verticals, Inc. | 0,34 | -0,06 | 9,48 | 11,32 | 0,1587 | 0,0112 | |||
| NDAQ / Nasdaq, Inc. | 0,10 | 0,00 | 9,34 | 17,88 | 0,1564 | 0,0191 | |||
| IBM / International Business Machines Corporation | 0,03 | -18,33 | 9,33 | -3,19 | 0,1561 | -0,0107 | |||
| USB / U.S. Bancorp | 0,20 | 0,00 | 8,96 | 7,17 | 0,1499 | 0,0052 | |||
| BLK / BlackRock, Inc. | 0,01 | 0,00 | 8,89 | 10,87 | 0,1487 | 0,0099 | |||
| WNS / WNS (Holdings) Limited | 0,14 | -0,01 | 8,88 | 2,84 | 0,1486 | -0,0009 | |||
| MDB / MongoDB, Inc. | 0,04 | -84,76 | 8,83 | -81,76 | 0,1478 | -0,6901 | |||
| EQIX / Equinix, Inc. | 0,01 | 0,00 | 8,58 | -2,43 | 0,1435 | -0,0087 | |||
| UL / Unilever PLC - Depositary Receipt (Common Stock) | 0,14 | 0,00 | 8,42 | 2,72 | 0,1410 | -0,0010 | |||
| WBS / Webster Financial Corporation | 0,15 | 0,28 | 8,28 | 6,21 | 0,1385 | 0,0036 | |||
| VRNS / Varonis Systems, Inc. | 0,16 | -0,04 | 8,21 | 25,41 | 0,1374 | 0,0241 | |||
| WSM / Williams-Sonoma, Inc. | 0,05 | -0,04 | 8,17 | 3,30 | 0,1368 | -0,0002 | |||
| OPCH / Option Care Health, Inc. | 0,25 | -0,03 | 8,16 | -7,10 | 0,1365 | -0,0155 | |||
| OLLI / Ollie's Bargain Outlet Holdings, Inc. | 0,06 | -17,21 | 8,13 | -6,23 | 0,1361 | -0,0141 | |||
| BL / BlackLine, Inc. | 0,14 | -0,02 | 8,03 | 16,92 | 0,1344 | 0,0155 | |||
| SWKS / Skyworks Solutions, Inc. | 0,11 | -25,53 | 7,97 | -14,13 | 0,1334 | -0,0273 | |||
| BWIN / The Baldwin Insurance Group, Inc. | 0,19 | 0,00 | 7,92 | -4,21 | 0,1326 | -0,0106 | |||
| STZ / Constellation Brands, Inc. | 0,05 | -0,03 | 7,87 | -11,39 | 0,1318 | -0,0221 | |||
| EVTC / EVERTEC, Inc. | 0,22 | 0,00 | 7,79 | -1,96 | 0,1304 | -0,0072 | |||
| TTEK / Tetra Tech, Inc. | 0,21 | 0,00 | 7,70 | 22,94 | 0,1289 | 0,0204 | |||
| JNJ / Johnson & Johnson | 0,05 | 0,00 | 7,58 | -7,89 | 0,1268 | -0,0156 | |||
| AMT / American Tower Corporation | 0,03 | -9,91 | 7,51 | -8,50 | 0,1258 | -0,0164 | |||
| SPSC / SPS Commerce, Inc. | 0,05 | 3,25 | 7,48 | 5,86 | 0,1252 | 0,0029 | |||
| GJR / Strats Trust For Procter & Gambel Security - Preferred Security | 0,05 | 0,00 | 7,44 | -6,51 | 0,1245 | -0,0133 | |||
| LZB / La-Z-Boy Incorporated | 0,20 | 0,00 | 7,41 | -4,91 | 0,1241 | -0,0109 | |||
| CB / Chubb Limited | 0,03 | -17,21 | 7,37 | -20,57 | 0,1233 | -0,0373 | |||
| CMCSA / Comcast Corporation | 0,20 | 0,00 | 7,31 | -3,28 | 0,1224 | -0,0085 | |||
| NOMD / Nomad Foods Limited | 0,43 | -0,02 | 7,26 | -13,56 | 0,1216 | -0,0239 | |||
| NEE / NextEra Energy, Inc. | 0,10 | 0,00 | 7,21 | -2,08 | 0,1207 | -0,0068 | |||
| ABBV / AbbVie Inc. | 0,04 | -12,68 | 7,19 | -22,64 | 0,1203 | -0,0406 | |||
| ICFI / ICF International, Inc. | 0,08 | 0,00 | 7,14 | -0,31 | 0,1195 | -0,0045 | |||
| NCNO / nCino, Inc. | 0,25 | 11,48 | 7,13 | 13,53 | 0,1193 | 0,0106 | |||
| UNP / Union Pacific Corporation | 0,03 | -0,03 | 6,99 | -2,65 | 0,1170 | -0,0073 | |||
| LECO / Lincoln Electric Holdings, Inc. | 0,03 | 0,00 | 6,92 | 9,61 | 0,1158 | 0,0065 | |||
| QLYS / Qualys, Inc. | 0,05 | -0,02 | 6,79 | 13,44 | 0,1136 | 0,0100 | |||
| APD / Air Products and Chemicals, Inc. | 0,02 | 0,00 | 6,74 | -4,36 | 0,1128 | -0,0092 | |||
| EXPO / Exponent, Inc. | 0,09 | 11,18 | 6,68 | 2,45 | 0,1118 | -0,0011 | |||
| CERT / Certara, Inc. | 0,56 | 0,00 | 6,54 | 18,19 | 0,1095 | 0,0136 | |||
| ROK / Rockwell Automation, Inc. | 0,02 | 9,75 | 6,52 | 41,12 | 0,1092 | 0,0291 | |||
| PLUS / ePlus inc. | 0,09 | -0,04 | 6,47 | 18,09 | 0,1083 | 0,0134 | |||
| COP / ConocoPhillips | 0,07 | 0,00 | 6,38 | -14,56 | 0,1067 | -0,0225 | |||
| ATRC / AtriCure, Inc. | 0,19 | 8,53 | 6,31 | 10,23 | 0,1057 | 0,0065 | |||
| TENB / Tenable Holdings, Inc. | 0,19 | 12,66 | 6,29 | 8,78 | 0,1054 | 0,0052 | |||
| PFE / Pfizer Inc. | 0,26 | -0,01 | 6,24 | -4,35 | 0,1045 | -0,0085 | |||
| CSCO / Cisco Systems, Inc. | 0,09 | 0,00 | 6,20 | 12,43 | 0,1038 | 0,0083 | |||
| ROAD / Construction Partners, Inc. | 0,06 | -43,95 | 6,15 | -17,12 | 0,1030 | -0,0256 | |||
| CSV / Carriage Services, Inc. | 0,13 | -0,04 | 6,09 | 17,99 | 0,1020 | 0,0126 | |||
| PHR / Phreesia, Inc. | 0,21 | 15,95 | 6,04 | 29,11 | 0,1011 | 0,0201 | |||
| BAH / Booz Allen Hamilton Holding Corporation | 0,06 | 7,17 | 6,03 | 6,71 | 0,1009 | 0,0031 | |||
| MDT / Medtronic plc | 0,07 | -33,65 | 5,98 | -35,64 | 0,1001 | -0,0608 | |||
| MDLZ / Mondelez International, Inc. | 0,09 | -86,07 | 5,98 | -86,15 | 0,1001 | -0,6474 | |||
| DD / DuPont de Nemours, Inc. | 0,09 | 0,00 | 5,88 | -8,15 | 0,0984 | -0,0124 | |||
| ALKT / Alkami Technology, Inc. | 0,19 | 5,84 | 0,0978 | 0,0978 | |||||
| KNX / Knight-Swift Transportation Holdings Inc. | 0,13 | 0,00 | 5,83 | 1,69 | 0,0975 | -0,0017 | |||
| SITE / SiteOne Landscape Supply, Inc. | 0,05 | 31,65 | 5,81 | 31,11 | 0,0973 | 0,0205 | |||
| WSO / Watsco, Inc. | 0,01 | 13,85 | 5,72 | -1,07 | 0,0957 | -0,0044 | |||
| POWI / Power Integrations, Inc. | 0,10 | -0,03 | 5,63 | 10,65 | 0,0943 | 0,0061 | |||
| WK / Workiva Inc. | 0,08 | 9,25 | 5,54 | -1,48 | 0,0927 | -0,0046 | |||
| CWST / Casella Waste Systems, Inc. | 0,05 | -0,06 | 5,50 | 3,40 | 0,0920 | -0,0000 | |||
| NKE / NIKE, Inc. | 0,07 | 0,00 | 5,28 | 11,90 | 0,0883 | 0,0067 | |||
| NOVT / Novanta Inc. | 0,04 | 0,00 | 5,22 | 0,83 | 0,0874 | -0,0023 | |||
| JJSF / J&J Snack Foods Corp. | 0,05 | 0,00 | 5,21 | -13,91 | 0,0873 | -0,0176 | |||
| MRTN / Marten Transport, Ltd. | 0,40 | 0,00 | 5,18 | -5,32 | 0,0867 | -0,0080 | |||
| TSCO / Tractor Supply Company | 0,10 | 0,00 | 5,15 | -4,24 | 0,0863 | -0,0069 | |||
| UFPT / UFP Technologies, Inc. | 0,02 | 0,05 | 5,08 | 21,12 | 0,0851 | 0,0124 | |||
| DCI / Donaldson Company, Inc. | 0,07 | -0,04 | 4,98 | 3,38 | 0,0834 | -0,0001 | |||
| INTA / Intapp, Inc. | 0,10 | 35,98 | 4,95 | 20,24 | 0,0828 | 0,0116 | |||
| MRK / Merck & Co., Inc. | 0,06 | -90,91 | 4,74 | -91,98 | 0,0794 | -0,9452 | |||
| TGT / Target Corporation | 0,05 | -22,67 | 4,72 | -26,92 | 0,0791 | -0,0328 | |||
| LII / Lennox International Inc. | 0,01 | 0,98 | 4,71 | 3,22 | 0,0788 | -0,0002 | |||
| GDYN / Grid Dynamics Holdings, Inc. | 0,38 | 4,33 | 4,44 | -23,00 | 0,0743 | -0,0255 | |||
| LW / Lamb Weston Holdings, Inc. | 0,08 | 0,00 | 4,24 | -2,71 | 0,0709 | -0,0045 | |||
| BX / Blackstone Inc. | 0,03 | 4,23 | 0,0708 | 0,0708 | |||||
| WEC / WEC Energy Group, Inc. | 0,04 | 0,00 | 4,14 | -4,41 | 0,0694 | -0,0057 | |||
| FIVN / Five9, Inc. | 0,15 | 0,00 | 4,06 | -2,45 | 0,0679 | -0,0041 | |||
| ONTO / Onto Innovation Inc. | 0,04 | 31,89 | 3,92 | 9,69 | 0,0656 | 0,0037 | |||
| RPAY / Repay Holdings Corporation | 0,78 | -0,01 | 3,77 | -13,46 | 0,0632 | -0,0124 | |||
| NXRT / NexPoint Residential Trust, Inc. | 0,11 | -0,02 | 3,70 | -15,72 | 0,0619 | -0,0141 | |||
| EPD / Enterprise Products Partners L.P. - Limited Partnership | 0,12 | 0,00 | 3,69 | -9,17 | 0,0618 | -0,0086 | |||
| FIX / Comfort Systems USA, Inc. | 0,01 | -43,19 | 3,57 | -5,49 | 0,0597 | -0,0056 | |||
| ARE / Alexandria Real Estate Equities, Inc. | 0,05 | 14,87 | 3,42 | -9,82 | 0,0572 | -0,0084 | |||
| SPXC / SPX Technologies, Inc. | 0,02 | 3,32 | 0,0556 | 0,0556 | |||||
| MUSA / Murphy USA Inc. | 0,01 | -0,06 | 3,31 | -13,46 | 0,0554 | -0,0108 | |||
| DGX / Quest Diagnostics Incorporated | 0,02 | -55,36 | 3,29 | -52,61 | 0,0551 | -0,0652 | |||
| AMED / Amedisys, Inc. | 0,03 | -55,70 | 3,24 | -52,94 | 0,0542 | -0,0650 | |||
| SLP / Simulations Plus, Inc. | 0,18 | 4,80 | 3,21 | -25,41 | 0,0537 | -0,0208 | |||
| OMCL / Omnicell, Inc. | 0,10 | 5,95 | 3,07 | -10,91 | 0,0514 | -0,0083 | |||
| MOD / Modine Manufacturing Company | 0,03 | 2,79 | 0,0466 | 0,0466 | |||||
| OC / Owens Corning | 0,02 | 2,16 | 0,0361 | 0,0361 | |||||
| WMB / The Williams Companies, Inc. | 0,03 | -0,08 | 2,05 | 5,03 | 0,0342 | 0,0005 | |||
| CRL / Charles River Laboratories International, Inc. | 0,00 | -98,81 | 0,13 | -98,80 | 0,0021 | -0,1789 | |||
| PM / Philip Morris International Inc. | 0,00 | -100,00 | 0,00 | 0,0000 | |||||
| BECN / Beacon Roofing Supply, Inc. | 0,00 | -100,00 | 0,00 | 0,0000 | |||||
| ETN / Eaton Corporation plc | 0,00 | -100,00 | 0,00 | 0,0000 | |||||
| CPRT / Copart, Inc. | 0,00 | -100,00 | 0,00 | 0,0000 | |||||
| NEOG / Neogen Corporation | 0,00 | -100,00 | 0,00 | 0,0000 | |||||
| KMX / CarMax, Inc. | 0,00 | -100,00 | 0,00 | 0,0000 |