Statistiche di base
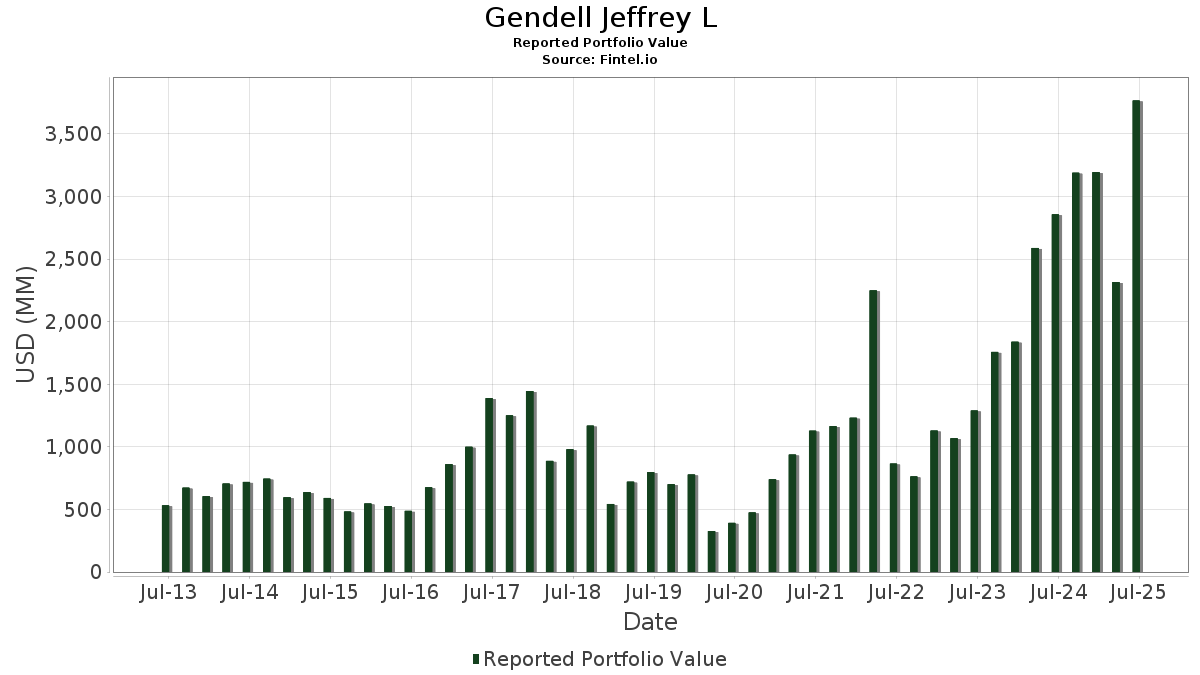
| Valore del portafoglio | $ 3.766.390.852 |
| Posizioni attuali | 77 |
Ultime partecipazioni, performance, AUM (da depositi 13F, 13D)
Gendell Jeffrey L ha dichiarato un totale di 77 partecipazioni negli ultimi documenti depositati presso la SEC. Il valore più recente del portafoglio è pari a $ 3.766.390.852 USD. Il patrimonio gestito effettivo (AUM) corrisponde a questo valore più la liquidità (che non viene dichiarata). Le principali partecipazioni di Gendell Jeffrey L sono IES Holdings, Inc. (US:IESC) , Avadel Pharmaceuticals plc (US:AVDL) , BlueLinx Holdings Inc. (US:BXC) , iShares Trust - iShares Russell 2000 ETF (US:IWM) , and Alpha Metallurgical Resources, Inc. (US:AMR) . Le nuove posizioni di Gendell Jeffrey L includono Apple Inc. (US:AAPL) , Flex Ltd. (US:FLEX) , Innovex International, Inc. (US:INVX) , Tecogen Inc. (US:TGEN) , and . Le industrie principali di Gendell Jeffrey L sono "Automotive Dealers And Gasoline Service Stations" (sic 55) , "Miscellaneous Retail " (sic 59) , and "Insurance Carriers" (sic 63) .
Gli aumenti più importanti di questo trimestre
Utilizziamo la variazione dell'allocazione del portafoglio perché è l'indicatore più significativo. Le variazioni possono essere dovute a transazioni o a variazioni dei prezzi delle azioni.
| Titolo | Azioni (in milioni) |
Valore (in milioni di $) |
Portafoglio % | ΔPortafoglio % |
|---|---|---|---|---|
| 10,68 | 3.162,65 | 83,9704 | 7,5675 | |
| 0,15 | 20,45 | 0,5431 | 0,5431 | |
| 0,17 | 36,68 | 0,5404 | 0,5404 | |
| 0,05 | 10,26 | 0,2724 | 0,2724 | |
| 0,17 | 10,67 | 0,1571 | 0,1571 | |
| 0,02 | 7,28 | 0,1073 | 0,1073 | |
| 0,07 | 6,46 | 0,0951 | 0,0951 | |
| 0,05 | 2,50 | 0,0663 | 0,0663 | |
| 0,15 | 4,22 | 0,0622 | 0,0622 | |
| 0,12 | 6,31 | 0,0930 | 0,0534 |
Gli aumenti più importanti di questo trimestre
Utilizziamo la variazione dell'allocazione del portafoglio perché è l'indicatore più significativo. Le variazioni possono essere dovute a transazioni o a variazioni dei prezzi delle azioni.
| Titolo | Azioni (in milioni) |
Valore (in milioni di $) |
Portafoglio % | ΔPortafoglio % |
|---|---|---|---|---|
| 5,18 | 45,81 | 0,6749 | -1,3964 | |
| 0,56 | 41,93 | 0,6177 | -0,9453 | |
| 0,30 | 33,34 | 0,4911 | -0,7334 | |
| 0,35 | 4,64 | 0,0684 | -0,7209 | |
| 0,06 | 4,87 | 0,0717 | -0,6889 | |
| 0,14 | 31,13 | 0,4587 | -0,6766 | |
| 1,40 | 3,63 | 0,0534 | -0,5672 | |
| 0,12 | 12,06 | 0,1776 | -0,5493 | |
| 1,94 | 15,17 | 0,2234 | -0,5456 | |
| 0,29 | 8,26 | 0,1217 | -0,5170 |
Depositi 13D/G
Questo è un elenco dei depositi 13D e 13G effettuati nell'ultimo anno (se presenti). Fai clic sull'icona del link per visualizzare la cronologia completa delle transazioni. Le righe verdi indicano le nuove posizioni. Le righe rosse indicano le posizioni chiuse.
| Data di deposito | Modulo | Titolo | Azioni precedenti |
Azioni attuali |
ΔAzioni % | % Proprietà |
% ΔProprietà | |
|---|---|---|---|---|---|---|---|---|
| 2025-08-14 | FRD / Friedman Industries, Incorporated | 453.129 | 354.576 | -21,75 | 5,00 | -23,08 | ||
| 2025-08-14 | KLXE / KLX Energy Services Holdings, Inc. | 1.526.795 | 1.693.219 | 10,90 | 9,50 | 2,04 | ||
| 2025-02-14 | NINE / Nine Energy Service, Inc. | 3.313.322 | 4.184.044 | 26,28 | 9,90 | 5,54 | ||
| 2024-11-13 | ASRV / AmeriServ Financial, Inc. | 1.246.113 | 1.572.987 | 26,23 | 9,52 | 30,95 | ||
| 2024-11-13 | FUSB / First US Bancshares, Inc. | 291.981 | 361.084 | 23,67 | 6,32 | 24,17 | ||
| 2024-11-13 | IROQ / IF Bancorp, Inc. | 272.040 | 326.382 | 19,98 | 9,73 | 19,98 |
13F e depositi di fondi
Questo modulo è stato depositato il 2025-08-14 per il periodo di riferimento 2025-06-30. Fai clic sull'icona del link per visualizzare la cronologia completa delle transazioni.
Esegui l'upgrade per sbloccare i dati premium ed esportarli in Excel ![]() .
.
| Titolo | Tipo | Prezzo medio dell'azione | Azioni (in milioni) |
ΔAzioni (%) |
ΔAzioni (%) |
Valore (in milioni di $) |
Portafoglio (%) |
ΔPortafoglio (%) |
|
|---|---|---|---|---|---|---|---|---|---|
| IESC / IES Holdings, Inc. | 10,68 | -0,39 | 3.162,65 | 78,72 | 83,9704 | 7,5675 | |||
| AVDL / Avadel Pharmaceuticals plc | 5,18 | -15,51 | 45,81 | -4,51 | 0,6749 | -1,3964 | |||
| BXC / BlueLinx Holdings Inc. | 0,56 | 16,76 | 41,93 | 15,82 | 0,6177 | -0,9453 | |||
| IWM / iShares Trust - iShares Russell 2000 ETF | 0,17 | 36,68 | 0,5404 | 0,5404 | |||||
| AMR / Alpha Metallurgical Resources, Inc. | 0,30 | 30,89 | 33,34 | 17,54 | 0,4911 | -0,7334 | |||
| OIH / VanEck ETF Trust - VanEck Oil Services ETF | 0,14 | 34,77 | 31,13 | 18,40 | 0,4587 | -0,6766 | |||
| MU / Micron Technology, Inc. | 0,17 | 116,88 | 20,58 | 207,65 | 0,3032 | 0,0144 | |||
| OC / Owens Corning | 0,15 | 20,45 | 0,5431 | 0,5431 | |||||
| SLB / Schlumberger Limited | 0,45 | 13,73 | 15,21 | -8,04 | 0,2241 | -0,4900 | |||
| LXU / LSB Industries, Inc. | 1,94 | -28,06 | 15,17 | -14,86 | 0,2234 | -0,5456 | |||
| INDV / Indivior PLC | 0,86 | 41,22 | 12,62 | 118,45 | 0,1860 | -0,0635 | |||
| TTI / TETRA Technologies, Inc. | 3,64 | -12,97 | 12,24 | -12,98 | 0,1803 | -0,4269 | |||
| MHK / Mohawk Industries, Inc. | 0,12 | -22,01 | 12,06 | -28,39 | 0,1776 | -0,5493 | |||
| SKY / Champion Homes, Inc. | 0,17 | 10,67 | 0,1571 | 0,1571 | |||||
| ATKR / Atkore Inc. | 0,15 | -24,76 | 10,59 | -11,52 | 0,1560 | -0,3607 | |||
| RBCAA / Republic Bancorp, Inc. | 0,14 | -2,59 | 10,45 | 11,60 | 0,1539 | -0,2503 | |||
| AAPL / Apple Inc. | 0,05 | 10,26 | 0,2724 | 0,2724 | |||||
| PATK / Patrick Industries, Inc. | 0,11 | 0,00 | 9,70 | 9,12 | 0,1428 | -0,2408 | |||
| OIS / Oil States International, Inc. | 1,61 | -4,11 | 8,62 | -0,20 | 0,1270 | -0,2458 | |||
| AMBC / Ambac Financial Group, Inc. | 1,20 | 98,98 | 8,51 | 61,44 | 0,1254 | -0,1022 | |||
| MTRX / Matrix Service Company | 0,61 | 2,90 | 8,30 | 11,83 | 0,1223 | -0,1982 | |||
| NBR / Nabors Industries Ltd. | 0,29 | -16,90 | 8,26 | -44,18 | 0,1217 | -0,5170 | |||
| IROQ / IF Bancorp, Inc. | 0,33 | -0,06 | 7,94 | 1,00 | 0,1170 | -0,2225 | |||
| XBI / SPDR Series Trust - SPDR S&P Biotech ETF | 0,09 | 137,55 | 7,65 | 142,92 | 0,1127 | -0,0233 | |||
| CNR / Core Natural Resources, Inc. | 0,11 | 87,71 | 7,50 | 69,81 | 0,1106 | -0,0803 | |||
| SNDK / Sandisk Corporation | 0,16 | 370,97 | 7,48 | 348,68 | 0,1101 | 0,0382 | |||
| CMI / Cummins Inc. | 0,02 | 7,28 | 0,1073 | 0,1073 | |||||
| AMD / Advanced Micro Devices, Inc. | 0,05 | 145,79 | 7,18 | 239,50 | 0,1057 | 0,0145 | |||
| LBRT / Liberty Energy Inc. | 0,59 | 23,47 | 6,76 | -10,47 | 0,0996 | -0,2263 | |||
| IOSP / Innospec Inc. | 0,08 | 3,28 | 6,71 | -8,35 | 0,0988 | -0,2172 | |||
| ODP / The ODP Corporation | 0,37 | -0,24 | 6,62 | 26,22 | 0,0975 | -0,1289 | |||
| CLB / Core Laboratories Inc. | 0,57 | 24,61 | 6,56 | -4,23 | 0,0966 | -0,1991 | |||
| UFPI / UFP Industries, Inc. | 0,07 | 6,46 | 0,0951 | 0,0951 | |||||
| GLW / Corning Incorporated | 0,12 | 500,00 | 6,31 | 589,62 | 0,0930 | 0,0534 | |||
| PEBK / Peoples Bancorp of North Carolina, Inc. | 0,22 | 0,00 | 6,28 | 5,92 | 0,0926 | -0,1635 | |||
| WDC / Western Digital Corporation | 0,10 | 111,11 | 6,08 | 234,19 | 0,0896 | 0,0110 | |||
| FRD / Friedman Industries, Incorporated | 0,35 | -17,80 | 5,87 | -8,59 | 0,0865 | -0,1908 | |||
| FUNC / First United Corporation | 0,18 | 0,00 | 5,53 | 3,29 | 0,0815 | -0,1497 | |||
| FMBH / First Mid Bancshares, Inc. | 0,14 | 0,00 | 5,15 | 7,42 | 0,0759 | -0,1312 | |||
| ALRS / Alerus Financial Corporation | 0,23 | -40,05 | 5,06 | -29,72 | 0,0745 | -0,2362 | |||
| ASRV / AmeriServ Financial, Inc. | 1,64 | 0,00 | 4,97 | 25,11 | 0,0733 | -0,0983 | |||
| FUSB / First US Bancshares, Inc. | 0,38 | 4,22 | 4,87 | 0,62 | 0,0718 | -0,1373 | |||
| MTRN / Materion Corporation | 0,06 | -58,91 | 4,87 | 5,71 | 0,0717 | -0,6889 | |||
| NOV / NOV Inc. | 0,39 | 49,66 | 4,82 | 22,24 | 0,0710 | -0,0993 | |||
| WTTR / Select Water Solutions, Inc. | 0,55 | -34,27 | 4,72 | -45,91 | 0,0695 | -0,3073 | |||
| BTU / Peabody Energy Corporation | 0,35 | -74,35 | 4,64 | -74,60 | 0,0684 | -0,7209 | |||
| COFS / ChoiceOne Financial Services, Inc. | 0,15 | -35,91 | 4,26 | -36,07 | 0,0628 | -0,2251 | |||
| WGO / Winnebago Industries, Inc. | 0,15 | 4,22 | 0,0622 | 0,0622 | |||||
| SND / Smart Sand, Inc. | 2,04 | 18,11 | 4,10 | -8,34 | 0,0604 | -0,1327 | |||
| TSEM / Tower Semiconductor Ltd. | 0,09 | 27,36 | 4,04 | 54,83 | 0,0595 | -0,0531 | |||
| DTI / Drilling Tools International Corporation | 1,41 | 20,87 | 4,03 | 45,35 | 0,0594 | -0,0603 | |||
| FCG / First Trust Exchange-Traded Fund - First Trust Natural Gas ETF | 0,16 | -57,83 | 3,70 | -60,78 | 0,0545 | -0,3526 | |||
| RIG / Transocean Ltd. | 1,40 | -69,13 | 3,63 | -74,77 | 0,0534 | -0,5672 | |||
| TILE / Interface, Inc. | 0,17 | 0,00 | 3,53 | 5,50 | 0,0520 | -0,0925 | |||
| CZWI / Citizens Community Bancorp, Inc. | 0,25 | -1,04 | 3,43 | -5,04 | 0,0505 | -0,1053 | |||
| NINE / Nine Energy Service, Inc. | 4,18 | -0,13 | 3,22 | -31,84 | 0,0475 | -0,1567 | |||
| KLXE / KLX Energy Services Holdings, Inc. | 1,69 | 1,20 | 3,17 | -45,94 | 0,0841 | -0,1688 | |||
| SLND / Southland Holdings, Inc. | 0,74 | 6,74 | 3,10 | 49,21 | 0,0457 | -0,0440 | |||
| PSCE / Invesco Exchange-Traded Fund Trust II - Invesco S&P SmallCap Energy ETF | 0,07 | -5,07 | 2,91 | -11,96 | 0,0429 | -0,0998 | |||
| COHR / Coherent Corp. | 0,03 | 0,00 | 2,80 | 37,40 | 0,0412 | -0,0467 | |||
| SXC / SunCoke Energy, Inc. | 0,29 | 7,02 | 2,51 | -0,04 | 0,0369 | -0,0714 | |||
| FLEX / Flex Ltd. | 0,05 | 2,50 | 0,0663 | 0,0663 | |||||
| CAC / Camden National Corporation | 0,06 | -49,41 | 2,49 | -49,28 | 0,0366 | -0,1750 | |||
| BW / Babcock & Wilcox Enterprises, Inc. | 2,57 | 49,25 | 2,48 | 113,53 | 0,0365 | -0,0136 | |||
| LUMN / Lumen Technologies, Inc. | 0,55 | 0,00 | 2,41 | 11,73 | 0,0355 | -0,0576 | |||
| BVFL / BV Financial, Inc. | 0,14 | 0,00 | 2,15 | -0,19 | 0,0317 | -0,0614 | |||
| SHBI / Shore Bancshares, Inc. | 0,14 | -51,72 | 2,15 | -43,94 | 0,0317 | -0,1340 | |||
| ORN / Orion Group Holdings, Inc. | 0,19 | -67,10 | 1,74 | -42,96 | 0,0256 | -0,1060 | |||
| FENC / Fennec Pharmaceuticals Inc. | 0,14 | -28,44 | 1,16 | -2,44 | 0,0171 | -0,0342 | |||
| BRBS / Blue Ridge Bankshares, Inc. | 0,31 | 11,12 | 1,12 | 22,40 | 0,0165 | -0,0230 | |||
| SBFG / SB Financial Group, Inc. | 0,05 | 0,00 | 0,88 | -8,20 | 0,0130 | -0,0286 | |||
| FRBA / First Bank | 0,05 | -15,21 | 0,76 | -11,36 | 0,0112 | -0,0257 | |||
| INVX / Innovex International, Inc. | 0,04 | 0,61 | 0,0163 | 0,0163 | |||||
| TGEN / Tecogen Inc. | 0,04 | 0,28 | 0,0075 | 0,0075 | |||||
| CIVB / Civista Bancshares, Inc. | 0,01 | 0,00 | 0,23 | 18,97 | 0,0034 | -0,0050 | |||
| OCC / Optical Cable Corporation | 0,07 | 51,00 | 0,20 | 57,60 | 0,0029 | -0,0025 | |||
| ASTL / Algoma Steel Group Inc. | 0,09 | 0,00 | 0,05 | 38,24 | 0,0007 | -0,0008 | |||
| EQT / EQT Corporation | 0,00 | -100,00 | 0,00 | 0,0000 | |||||
| XLE / The Select Sector SPDR Trust - The Energy Select Sector SPDR Fund | 0,00 | -100,00 | 0,00 | 0,0000 | |||||
| IWN / iShares Trust - iShares Russell 2000 Value ETF | 0,00 | -100,00 | 0,00 | 0,0000 | |||||
| HP / Helmerich & Payne, Inc. | 0,00 | -100,00 | 0,00 | 0,0000 | |||||
| HBT / HBT Financial, Inc. | 0,00 | -100,00 | 0,00 | 0,0000 | |||||
| KRE / SPDR Series Trust - SPDR S&P Regional Banking ETF | 0,00 | -100,00 | 0,00 | 0,0000 | |||||
| HAL / Halliburton Company | 0,00 | -100,00 | 0,00 | 0,0000 | |||||
| HWBK / Hawthorn Bancshares, Inc. | 0,00 | -100,00 | 0,00 | 0,0000 | |||||
| C / Citigroup Inc. | 0,00 | -100,00 | 0,00 | 0,0000 | |||||
| SDRL / Seadrill Limited | 0,00 | -100,00 | 0,00 | 0,0000 | |||||
| CMT / Core Molding Technologies, Inc. | 0,00 | -100,00 | 0,00 | 0,0000 | |||||
| BORR / Borr Drilling Limited | 0,00 | -100,00 | 0,00 | 0,0000 | |||||
| QXO / QXO, Inc. | 0,00 | -100,00 | 0,00 | 0,0000 |