Statistiche di base
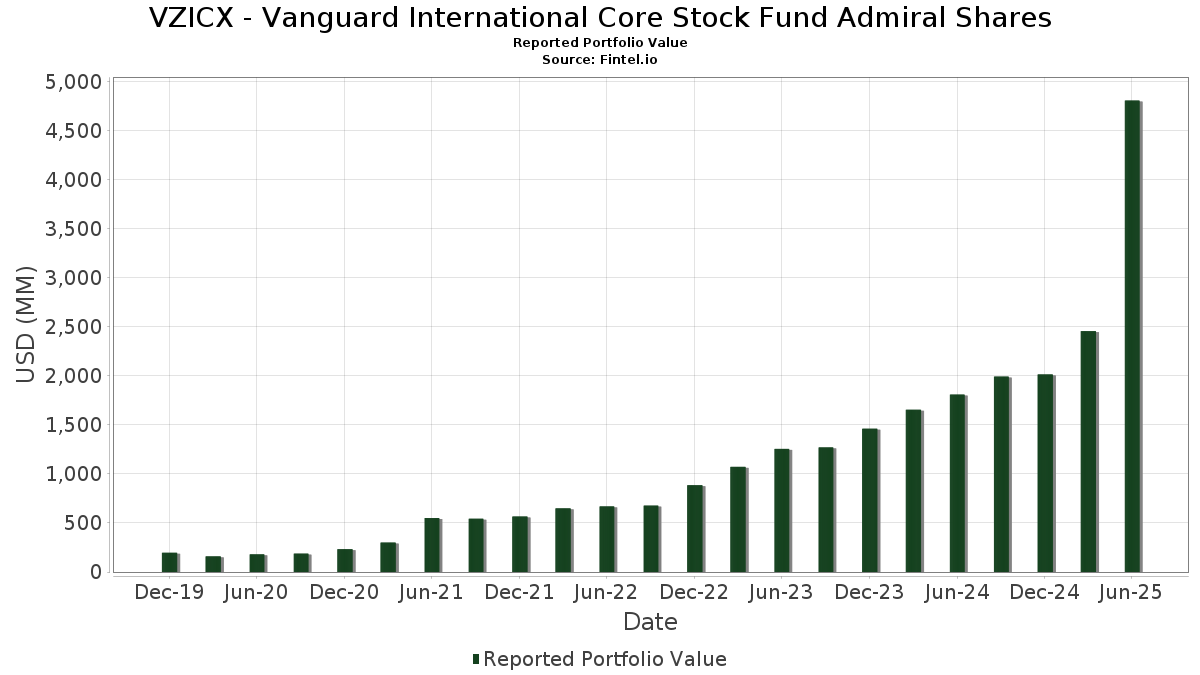
| Valore del portafoglio | $ 4.808.159.056 |
| Posizioni attuali | 99 |
Ultime partecipazioni, performance, AUM (da depositi 13F, 13D)
VZICX - Vanguard International Core Stock Fund Admiral Shares ha dichiarato un totale di 99 partecipazioni negli ultimi documenti depositati presso la SEC. Il valore più recente del portafoglio è pari a $ 4.808.159.056 USD. Il patrimonio gestito effettivo (AUM) corrisponde a questo valore più la liquidità (che non viene dichiarata). Le principali partecipazioni di VZICX - Vanguard International Core Stock Fund Admiral Shares sono Taiwan Semiconductor Manufacturing Company Limited (TW:2330) , Tencent Holdings Limited (HK:700) , Vanguard Tax-Managed Funds - Vanguard FTSE Developed Markets ETF (US:VEA) , Royal Bank of Canada (US:RY) , and Shell plc (GB:SHEL) . Le nuove posizioni di VZICX - Vanguard International Core Stock Fund Admiral Shares includono Hong Kong Exchanges and Clearing Limited (HK:388) , Prudential plc (GB:PRU) , HDFC Bank Ltd (IN:HDFCB) , Compagnie de Saint-Gobain S.A. (CH:GOB) , and Bank Leumi le-Israel B.M. (IL:LUMI) .
Gli aumenti più importanti di questo trimestre
Utilizziamo la variazione dell'allocazione del portafoglio perché è l'indicatore più significativo. Le variazioni possono essere dovute a transazioni o a variazioni dei prezzi delle azioni.
| Titolo | Azioni (in milioni) |
Valore (in milioni di $) |
Portafoglio % | ΔPortafoglio % |
|---|---|---|---|---|
| 0,53 | 53,49 | 1,1096 | 1,1096 | |
| 0,93 | 50,24 | 1,0422 | 1,0422 | |
| 3,94 | 49,34 | 1,0236 | 1,0236 | |
| 2,09 | 48,89 | 1,0141 | 1,0141 | |
| 0,74 | 97,29 | 2,0182 | 0,9823 | |
| 1,65 | 44,49 | 0,9229 | 0,9229 | |
| 0,37 | 43,37 | 0,8996 | 0,8996 | |
| 2,20 | 40,85 | 0,8474 | 0,8474 | |
| 15,35 | 37,64 | 0,7807 | 0,7807 | |
| 0,02 | 36,95 | 0,7665 | 0,7665 |
Gli aumenti più importanti di questo trimestre
Utilizziamo la variazione dell'allocazione del portafoglio perché è l'indicatore più significativo. Le variazioni possono essere dovute a transazioni o a variazioni dei prezzi delle azioni.
| Titolo | Azioni (in milioni) |
Valore (in milioni di $) |
Portafoglio % | ΔPortafoglio % |
|---|---|---|---|---|
| 1,96 | 30,51 | 0,6329 | -0,7759 | |
| 0,75 | 42,65 | 0,8847 | -0,7352 | |
| 14,09 | 27,38 | 0,5680 | -0,6385 | |
| 2,26 | 38,12 | 0,7907 | -0,5644 | |
| 0,35 | 25,86 | 0,5363 | -0,5588 | |
| 1,68 | 37,49 | 0,7777 | -0,5512 | |
| 5,37 | 26,21 | 0,5437 | -0,4890 | |
| 3,05 | 79,30 | 1,6451 | -0,4697 | |
| 8,83 | 40,82 | 0,8467 | -0,4180 | |
| 1,42 | 62,93 | 1,3054 | -0,3921 |
13F e depositi di fondi
Questo modulo è stato depositato il 2025-08-27 per il periodo di riferimento 2025-06-30. Fai clic sull'icona del link per visualizzare la cronologia completa delle transazioni.
Esegui l'upgrade per sbloccare i dati premium ed esportarli in Excel ![]() .
.
| Titolo | Tipo | Prezzo medio dell'azione | Azioni (in milioni) |
ΔAzioni (%) |
ΔAzioni (%) |
Valore (in milioni di $) |
Portafoglio (%) |
ΔPortafoglio (%) |
|
|---|---|---|---|---|---|---|---|---|---|
| 2330 / Taiwan Semiconductor Manufacturing Company Limited | 5,38 | 72,91 | 196,71 | 124,52 | 4,0806 | 0,5090 | |||
| 700 / Tencent Holdings Limited | 1,60 | 102,12 | 103,14 | 103,82 | 2,1395 | 0,0768 | |||
| VEA / Vanguard Tax-Managed Funds - Vanguard FTSE Developed Markets ETF | 1,79 | 115,77 | 102,12 | 142,01 | 2,1184 | 0,3983 | |||
| RY / Royal Bank of Canada | 0,74 | 227,20 | 97,29 | 282,83 | 2,0182 | 0,9823 | |||
| SHEL / Shell plc | 2,46 | 72,91 | 85,98 | 65,73 | 1,7835 | -0,3313 | |||
| 6758 / Sony Group Corporation | 3,05 | 48,76 | 79,30 | 52,86 | 1,6451 | -0,4697 | |||
| NVO / Novo Nordisk A/S - Depositary Receipt (Common Stock) | 1,14 | 102,79 | 78,89 | 105,51 | 1,6364 | 0,0716 | |||
| TSCO / Tesco PLC | 14,07 | 72,91 | 77,60 | 121,59 | 1,6096 | 0,1821 | |||
| ASML / ASML Holding N.V. | 0,09 | 200,12 | 75,93 | 263,43 | 1,5750 | 0,7234 | |||
| SAPGF / SAP SE | 0,23 | 50,59 | 71,81 | 71,85 | 1,4895 | -0,2137 | |||
| 1299 / AIA Group Limited | 7,91 | 101,11 | 71,61 | 140,66 | 1,4855 | 0,2725 | |||
| ENGI / Engie SA | 3,04 | 72,91 | 71,45 | 108,55 | 1,4823 | 0,0856 | |||
| 000660 / SK hynix Inc. | 0,31 | 72,91 | 66,05 | 179,49 | 1,3702 | 0,4068 | |||
| 2RR / Alibaba Group Holding Limited | 4,60 | 235,88 | 65,18 | 275,40 | 1,3521 | -0,2681 | |||
| FP / TotalEnergies SE | 1,06 | 90,54 | 64,58 | 80,75 | 1,3397 | -0,1168 | |||
| UBSG / UBS Group AG | 1,88 | 692,81 | 63,99 | 1.640,14 | 1,3273 | 0,0915 | |||
| GRAB / Grab Holdings Limited | 12,56 | 116,67 | 63,20 | 140,59 | 1,3110 | 0,2402 | |||
| SSNLF / Samsung Electronics Co., Ltd. | 1,42 | 179,95 | 62,93 | 110,35 | 1,3054 | -0,3921 | |||
| FBK / FinecoBank Banca Fineco S.p.A. | 2,78 | 72,91 | 61,73 | 93,66 | 1,2806 | -0,0189 | |||
| MITS N / Mitsubishi Electric Corporation | 2,84 | 116,80 | 61,09 | 152,85 | 1,2673 | 0,2824 | |||
| A5G / AIB Group plc | 7,34 | 72,91 | 60,57 | 120,92 | 1,2565 | 0,1388 | |||
| RSNHF / Resona Holdings, Inc. | 6,51 | 96,47 | 60,11 | 107,81 | 1,2469 | 0,0678 | |||
| MFG / Mizuho Financial Group, Inc. - Depositary Receipt (Common Stock) | 2,09 | 152,70 | 58,06 | 155,61 | 1,2045 | 0,2785 | |||
| AZN / Astrazeneca plc | 0,42 | 72,91 | 57,76 | 63,87 | 1,1982 | -0,2387 | |||
| 2454 / MediaTek Inc. | 1,35 | 103,27 | 57,75 | 102,09 | 1,1979 | 0,0331 | |||
| DEVL / DBS Group Holdings Ltd | 1,60 | 72,90 | 56,59 | 77,74 | 1,1739 | -0,1240 | |||
| SIE / Siemens Aktiengesellschaft | 0,22 | 72,91 | 56,20 | 92,31 | 1,1659 | -0,0255 | |||
| SPOT / Spotify Technology S.A. | 0,07 | 72,91 | 56,17 | 141,22 | 1,1653 | 0,2160 | |||
| NTR / Nutrien Ltd. | 0,96 | 72,91 | 55,96 | 103,01 | 1,1608 | 0,0372 | |||
| AC / Accor SA | 1,06 | 72,91 | 55,34 | 98,70 | 1,1480 | 0,0126 | |||
| KBC / KBC Group NV | 0,53 | 108,89 | 54,65 | 136,55 | 1,1336 | 0,1918 | |||
| NTTYY / NTT, Inc. - Depositary Receipt (Common Stock) | 51,06 | 72,91 | 54,59 | 91,27 | 1,1325 | -0,0310 | |||
| OS1 / Otsuka Holdings Co., Ltd. | 1,09 | 180,09 | 53,84 | 166,48 | 1,1169 | 0,2933 | |||
| Vanguard Market Liquidity Fund / STIV (N/A) | 0,53 | 53,49 | 1,1096 | 1,1096 | |||||
| HLN / Haleon plc - Depositary Receipt (Common Stock) | 10,17 | 128,80 | 52,29 | 132,86 | 1,0846 | 0,1693 | |||
| RHM / Rheinmetall AG | 0,02 | 35,11 | 52,16 | 99,96 | 1,0821 | 0,0186 | |||
| SLF / Sun Life Financial Inc. | 0,78 | 72,91 | 51,69 | 101,03 | 1,0724 | 0,0241 | |||
| 8801 / Mitsui Fudosan Co., Ltd. | 5,27 | 115,20 | 51,05 | 132,64 | 1,0590 | 0,1645 | |||
| LR / Legrand SA | 0,38 | 33,08 | 50,61 | 68,42 | 1,0498 | -0,1751 | |||
| 388 / Hong Kong Exchanges and Clearing Limited | 0,93 | 50,24 | 1,0422 | 1,0422 | |||||
| PRU / Prudential plc | 3,94 | 49,34 | 1,0236 | 1,0236 | |||||
| B / Barrick Mining Corporation | 2,36 | 72,91 | 49,23 | 85,41 | 1,0213 | -0,0612 | |||
| HDFCB / HDFC Bank Ltd | 2,09 | 48,89 | 1,0141 | 1,0141 | |||||
| IDEXY / Industria de Diseño Textil, S.A. - Depositary Receipt (Common Stock) | 0,94 | 72,91 | 48,84 | 81,15 | 1,0132 | -0,0859 | |||
| FANUY / Fanuc Corporation - Depositary Receipt (Common Stock) | 1,76 | 72,92 | 47,73 | 72,29 | 0,9901 | -0,1392 | |||
| SGP / Stockland - Debt/Equity Composite Units | 13,20 | 72,91 | 46,67 | 98,04 | 0,9681 | 0,0075 | |||
| HEI / Heidelberg Materials AG | 0,20 | 72,91 | 46,46 | 136,22 | 0,9638 | 0,1620 | |||
| AETUF / ARC Resources Ltd. | 2,20 | 72,91 | 46,31 | 81,34 | 0,9607 | -0,0804 | |||
| 3088 / MatsukiyoCocokara & Co. | 2,20 | 39,88 | 45,23 | 83,94 | 0,9383 | -0,0642 | |||
| EOAN / E.ON SE | 2,45 | 72,91 | 45,15 | 111,06 | 0,9367 | 0,0646 | |||
| VOLVB / Volvo AB | 1,59 | 72,91 | 44,80 | 65,83 | 0,9294 | -0,1720 | |||
| 9999 / NetEase, Inc. | 1,65 | 44,49 | 0,9229 | 0,9229 | |||||
| 4307 / Nomura Research Institute, Ltd. | 1,11 | 72,91 | 44,28 | 112,46 | 0,9185 | 0,0690 | |||
| TLX / Talanx AG | 0,34 | 124,35 | 44,17 | 176,54 | 0,9163 | 0,2652 | |||
| 2502 / Asahi Group Holdings, Ltd. | 3,28 | 72,91 | 43,87 | 80,91 | 0,9100 | -0,0785 | |||
| GOB / Compagnie de Saint-Gobain S.A. | 0,37 | 43,37 | 0,8996 | 0,8996 | |||||
| AER / AerCap Holdings N.V. | 0,37 | 72,91 | 43,07 | 98,01 | 0,8934 | 0,0067 | |||
| YUMC / Yum China Holdings, Inc. | 0,95 | 93,45 | 42,87 | 66,18 | 0,8894 | -0,1624 | |||
| GLE / Société Générale Société anonyme | 0,75 | -15,36 | 42,65 | 7,33 | 0,8847 | -0,7352 | |||
| M&M / Mahindra & Mahindra Limited | 1,12 | 120,93 | 41,47 | 164,19 | 0,8602 | 0,2203 | |||
| LUMI / Bank Leumi le-Israel B.M. | 2,20 | 40,85 | 0,8474 | 0,8474 | |||||
| BARC / Barclays PLC | 8,83 | 7,05 | 40,82 | 31,56 | 0,8467 | -0,4180 | |||
| GLEN / Glencore plc | 10,14 | 72,91 | 39,51 | 84,08 | 0,8195 | -0,0553 | |||
| ICICIBANK / ICICI Bank Limited | 2,26 | 6,64 | 38,12 | 14,66 | 0,7907 | -0,5644 | |||
| ABEV3 / Ambev S.A. | 15,35 | 37,64 | 0,7807 | 0,7807 | |||||
| MSADF / MS&AD Insurance Group Holdings, Inc. | 1,68 | 35,09 | 37,49 | 39,83 | 0,7777 | -0,5512 | |||
| ADS / adidas AG | 0,16 | 72,91 | 37,28 | 71,13 | 0,7733 | -0,1147 | |||
| DP4B / A.P. Møller - Mærsk A/S | 0,02 | 36,95 | 0,7665 | 0,7665 | |||||
| 012450 / Hanwha Aerospace Co., Ltd. | 0,06 | 36,79 | 0,7633 | 0,7633 | |||||
| ML / Compagnie Générale des Établissements Michelin Société en commandite par actions | 0,99 | 36,75 | 0,7624 | 0,7624 | |||||
| SBSP3 / Companhia de Saneamento Básico do Estado de São Paulo - SABESP | 1,65 | 72,91 | 36,27 | 112,12 | 0,7524 | 0,0553 | |||
| 4GNB / Wal-Mart de México, S.A.B. de C.V. | 10,82 | 18,74 | 35,85 | 42,80 | 0,7437 | -0,2797 | |||
| GALD / Galderma Group AG | 0,25 | 27,31 | 35,63 | 75,11 | 0,7391 | -0,0904 | |||
| 1216 / Uni-President Enterprises Corp. | 12,65 | 72,92 | 35,06 | 96,56 | 0,7272 | 0,0002 | |||
| VIVT3 / Telefônica Brasil S.A. | 6,08 | 97,52 | 34,56 | 28,61 | 0,7170 | -0,3786 | |||
| X5Z1 / ANZ Group Holdings Limited | 1,70 | 72,91 | 32,54 | 81,11 | 0,6750 | -0,0574 | |||
| PHIA / Koninklijke Philips N.V. | 1,34 | 72,91 | 32,27 | 63,09 | 0,6694 | -0,1372 | |||
| LUNMF / Lundin Mining Corporation | 3,04 | 71,53 | 31,99 | 122,62 | 0,6636 | 0,0778 | |||
| EMAAR / Emaar Properties PJSC | 8,57 | 145,11 | 31,79 | 151,09 | 0,6594 | 0,1433 | |||
| 105560 / KB Financial Group Inc. | 0,38 | 23,37 | 30,84 | 87,04 | 0,6397 | -0,0324 | |||
| RKT / Reckitt Benckiser Group plc | 0,45 | 30,74 | 0,6376 | 0,6376 | |||||
| 9961 / Trip.com Group Limited | 0,52 | 72,90 | 30,70 | 59,29 | 0,6369 | -0,1488 | |||
| BY6 / BYD Company Limited | 1,96 | 187,09 | 30,51 | -11,72 | 0,6329 | -0,7759 | |||
| 500510 / Larsen & Toubro Limited | 0,70 | 31,17 | 30,07 | 38,06 | 0,6237 | -0,2640 | |||
| BT.A / BT Group plc | 10,76 | 365,85 | 28,66 | 822,87 | 0,5944 | 0,1386 | |||
| HMC / Honda Motor Co., Ltd. - Depositary Receipt (Common Stock) | 2,95 | 70,19 | 28,46 | 81,35 | 0,5905 | -0,0494 | |||
| NXG / NEXT plc | 0,17 | 70,18 | 28,43 | 101,75 | 0,5897 | 0,0153 | |||
| APOLLOHOSP / Apollo Hospitals Enterprise Limited | 0,33 | 28,24 | 0,5859 | 0,5859 | |||||
| 2328 / PICC Property and Casualty Company Limited | 14,09 | -11,84 | 27,38 | -7,48 | 0,5680 | -0,6385 | |||
| SIT4 / Singapore Telecommunications Limited | 8,86 | 20,88 | 26,71 | 43,69 | 0,5541 | -0,2037 | |||
| KPN / Koninklijke KPN N.V. | 5,37 | 202,25 | 26,21 | 371,43 | 0,5437 | -0,4890 | |||
| VBL / Varun Beverages Limited | 4,90 | 179,82 | 26,13 | 137,30 | 0,5421 | 0,0932 | |||
| HOLN / Holcim AG | 0,35 | 39,47 | 25,86 | -3,76 | 0,5363 | -0,5588 | |||
| AAL / Anglo American plc | 0,87 | 25,66 | 0,5322 | 0,5322 | |||||
| TECHM / Tech Mahindra Limited | 1,27 | 13,15 | 25,08 | 35,00 | 0,5203 | -0,2371 | |||
| INE670K01029 / Macrotech Developers Ltd | 1,35 | 30,38 | 21,78 | 51,09 | 0,4519 | -0,1359 | |||
| BAJAJ-AUTO / Bajaj Auto Limited | 0,20 | 61,54 | 19,41 | 71,87 | 0,4027 | -0,0577 | |||
| J0124501F / Hanwha Aerospace Co., Ltd. - Equity Right | 0,00 | 0,51 | 0,0107 | 0,0107 | |||||
| Vanguard Market Liquidity Fund / STIV (N/A) | 0,00 | 0,00 | 0,0000 | 0,0000 | |||||
| MGNT / Public Joint Stock Company Magnit | 0,03 | 0,00 | 0,00 | 0,0000 | 0,0000 |