Statistiche di base
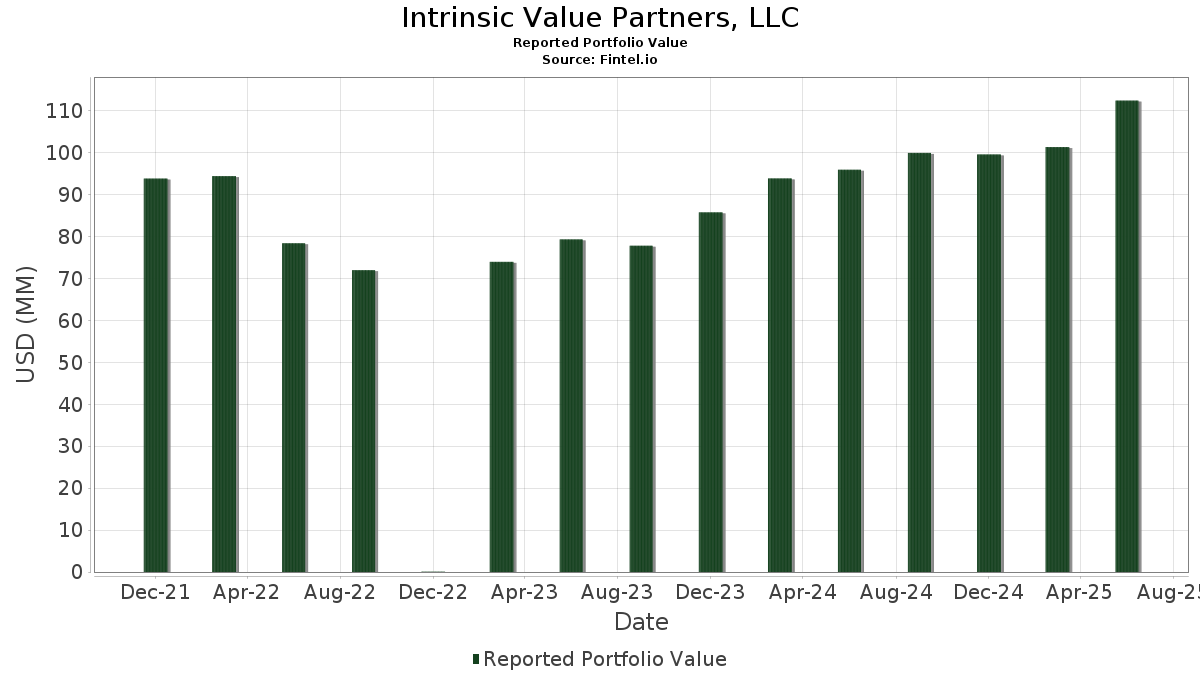
| Valore del portafoglio | $ 112.394.470 |
| Posizioni attuali | 67 |
Ultime partecipazioni, performance, AUM (da depositi 13F, 13D)
Intrinsic Value Partners, LLC ha dichiarato un totale di 67 partecipazioni negli ultimi documenti depositati presso la SEC. Il valore più recente del portafoglio è pari a $ 112.394.470 USD. Il patrimonio gestito effettivo (AUM) corrisponde a questo valore più la liquidità (che non viene dichiarata). Le principali partecipazioni di Intrinsic Value Partners, LLC sono Berkshire Hathaway Inc. (US:BRK.B) , Alphabet Inc. (US:GOOG) , Meta Platforms, Inc. (US:META) , The St. Joe Company (US:JOE) , and Taiwan Semiconductor Manufacturing Company Limited - Depositary Receipt (Common Stock) (US:TSM) . Le nuove posizioni di Intrinsic Value Partners, LLC includono Builders FirstSource, Inc. (US:BLDR) , Applied Materials, Inc. (US:AMAT) , Airbnb, Inc. (US:ABNB) , Capital Group New Geography Equity ETF (US:CGNG) , and International Business Machines Corporation (US:IBM) .
Gli aumenti più importanti di questo trimestre
Utilizziamo la variazione dell'allocazione del portafoglio perché è l'indicatore più significativo. Le variazioni possono essere dovute a transazioni o a variazioni dei prezzi delle azioni.
| Titolo | Azioni (in milioni) |
Valore (in milioni di $) |
Portafoglio % | ΔPortafoglio % |
|---|---|---|---|---|
| 0,01 | 1,74 | 1,5480 | 1,5480 | |
| 0,02 | 5,06 | 4,5004 | 0,7822 | |
| 0,00 | 0,79 | 0,7032 | 0,7032 | |
| 0,02 | 4,17 | 3,7098 | 0,6934 | |
| 0,01 | 6,38 | 5,6771 | 0,6852 | |
| 0,01 | 4,31 | 3,8343 | 0,5319 | |
| 0,02 | 4,28 | 3,8097 | 0,4794 | |
| 0,00 | 0,36 | 0,3222 | 0,3222 | |
| 0,06 | 5,04 | 4,4878 | 0,2971 | |
| 0,01 | 1,53 | 1,3619 | 0,2652 |
Gli aumenti più importanti di questo trimestre
Utilizziamo la variazione dell'allocazione del portafoglio perché è l'indicatore più significativo. Le variazioni possono essere dovute a transazioni o a variazioni dei prezzi delle azioni.
| Titolo | Azioni (in milioni) |
Valore (in milioni di $) |
Portafoglio % | ΔPortafoglio % |
|---|---|---|---|---|
| 0,03 | 15,14 | 13,4669 | -3,3819 | |
| 0,11 | 5,12 | 4,5530 | -0,4752 | |
| 0,03 | 2,96 | 2,6336 | -0,4238 | |
| 0,01 | 0,22 | 0,1968 | -0,4020 | |
| 0,06 | 2,67 | 2,3722 | -0,3719 | |
| 0,02 | 1,21 | 1,0737 | -0,3152 | |
| 0,03 | 0,79 | 0,7067 | -0,3065 | |
| 0,00 | 0,22 | 0,1986 | -0,2488 | |
| 0,01 | 0,73 | 0,6485 | -0,2095 | |
| 0,00 | 0,00 | -0,2076 |
13F e depositi di fondi
Questo modulo è stato depositato il 2025-07-21 per il periodo di riferimento 2025-06-30. Fai clic sull'icona del link per visualizzare la cronologia completa delle transazioni.
Esegui l'upgrade per sbloccare i dati premium ed esportarli in Excel ![]() .
.
| Titolo | Tipo | Prezzo medio dell'azione | Azioni (in milioni) |
ΔAzioni (%) |
ΔAzioni (%) |
Valore (in milioni di $) |
Portafoglio (%) |
ΔPortafoglio (%) |
|
|---|---|---|---|---|---|---|---|---|---|
| BRK.B / Berkshire Hathaway Inc. | 0,03 | -2,79 | 15,14 | -11,33 | 13,4669 | -3,3819 | |||
| GOOG / Alphabet Inc. | 0,05 | -1,56 | 8,76 | 11,76 | 7,7956 | 0,0580 | |||
| META / Meta Platforms, Inc. | 0,01 | -1,48 | 6,38 | 26,16 | 5,6771 | 0,6852 | |||
| JOE / The St. Joe Company | 0,11 | -1,13 | 5,12 | 0,45 | 4,5530 | -0,4752 | |||
| TSM / Taiwan Semiconductor Manufacturing Company Limited - Depositary Receipt (Common Stock) | 0,02 | -1,59 | 5,06 | 34,27 | 4,5004 | 0,7822 | |||
| SCHW / The Charles Schwab Corporation | 0,06 | 1,93 | 5,04 | 18,82 | 4,4878 | 0,2971 | |||
| GOOGL / Alphabet Inc. | 0,03 | 0,95 | 4,57 | 15,03 | 4,0648 | 0,1453 | |||
| MSFT / Microsoft Corporation | 0,01 | -2,79 | 4,31 | 28,82 | 3,8343 | 0,5319 | |||
| GE / General Electric Company | 0,02 | -1,32 | 4,28 | 26,88 | 3,8097 | 0,4794 | |||
| VTV / Vanguard Index Funds - Vanguard Value ETF | 0,02 | 33,35 | 4,17 | 36,42 | 3,7098 | 0,6934 | |||
| AXP / American Express Company | 0,01 | -0,32 | 3,19 | 18,17 | 2,8423 | 0,1742 | |||
| BK / The Bank of New York Mellon Corporation | 0,03 | -12,03 | 2,96 | -4,42 | 2,6336 | -0,4238 | |||
| OXY / Occidental Petroleum Corporation | 0,06 | 12,68 | 2,67 | -4,10 | 2,3722 | -0,3719 | |||
| PAYC / Paycom Software, Inc. | 0,01 | -0,38 | 2,45 | 5,52 | 2,1772 | -0,1119 | |||
| VB / Vanguard Index Funds - Vanguard Small-Cap ETF | 0,01 | 17,85 | 2,26 | 25,95 | 2,0089 | 0,2394 | |||
| J / Jacobs Solutions Inc. | 0,02 | -3,95 | 2,00 | 4,44 | 1,7781 | -0,1106 | |||
| BLDR / Builders FirstSource, Inc. | 0,01 | 1,74 | 1,5480 | 1,5480 | |||||
| JEF / Jefferies Financial Group Inc. | 0,03 | -0,20 | 1,63 | 1,87 | 1,4536 | -0,1292 | |||
| SHOP / Shopify Inc. | 0,01 | -0,60 | 1,58 | 20,08 | 1,4054 | 0,1071 | |||
| IJR / iShares Trust - iShares Core S&P Small-Cap ETF | 0,01 | 31,81 | 1,53 | 37,71 | 1,3619 | 0,2652 | |||
| BKNG / Booking Holdings Inc. | 0,00 | -2,40 | 1,41 | 22,68 | 1,2568 | 0,1200 | |||
| UI / Ubiquiti Inc. | 0,00 | -1,71 | 1,28 | 30,51 | 1,1387 | 0,1704 | |||
| WFC / Wells Fargo & Company | 0,02 | -0,61 | 1,22 | 10,95 | 1,0822 | -0,0001 | |||
| MRK / Merck & Co., Inc. | 0,02 | -2,76 | 1,21 | -14,29 | 1,0737 | -0,3152 | |||
| VXUS / Vanguard STAR Funds - Vanguard Total International Stock ETF | 0,01 | 27,69 | 0,97 | 42,14 | 0,8616 | 0,1888 | |||
| XLE / The Select Sector SPDR Trust - The Energy Select Sector SPDR Fund | 0,01 | 3,17 | 0,88 | -6,47 | 0,7856 | -0,1452 | |||
| ICE / Intercontinental Exchange, Inc. | 0,00 | -1,73 | 0,87 | 4,55 | 0,7768 | -0,0477 | |||
| CRBG / Corebridge Financial, Inc. | 0,02 | 1,04 | 0,86 | 13,68 | 0,7691 | 0,0181 | |||
| NVDD / Direxion Shares ETF Trust - Direxion Daily NVDA Bear 1X Shares | 0,01 | -7,38 | 0,85 | 35,02 | 0,7584 | 0,1352 | |||
| ASML / ASML Holding N.V. - Depositary Receipt (Common Stock) | 0,00 | -0,48 | 0,83 | 20,35 | 0,7422 | 0,0581 | |||
| MKL / Markel Group Inc. | 0,00 | -0,98 | 0,81 | 5,74 | 0,7215 | -0,0351 | |||
| PINS / Pinterest, Inc. | 0,02 | -3,15 | 0,80 | 12,13 | 0,7076 | 0,0069 | |||
| MRNA / Moderna, Inc. | 0,03 | -20,49 | 0,79 | -22,61 | 0,7067 | -0,3065 | |||
| AMAT / Applied Materials, Inc. | 0,00 | 0,79 | 0,7032 | 0,7032 | |||||
| VTI / Vanguard Index Funds - Vanguard Total Stock Market ETF | 0,00 | -5,37 | 0,76 | 4,68 | 0,6763 | -0,0407 | |||
| KMX / CarMax, Inc. | 0,01 | -2,79 | 0,73 | -16,23 | 0,6485 | -0,2095 | |||
| BRK.A / Berkshire Hathaway Inc. | 0,00 | 0,00 | 0,73 | -8,77 | 0,6484 | -0,1397 | |||
| BAC / Bank of America Corporation | 0,01 | -1,44 | 0,65 | 11,92 | 0,5767 | 0,0043 | |||
| BA / The Boeing Company | 0,00 | -0,32 | 0,65 | 22,35 | 0,5753 | 0,0541 | |||
| JPM / JPMorgan Chase & Co. | 0,00 | 0,74 | 0,63 | 18,98 | 0,5636 | 0,0384 | |||
| GEV / GE Vernova Inc. | 0,00 | -40,15 | 0,61 | 3,76 | 0,5405 | -0,0375 | |||
| AMZN / Amazon.com, Inc. | 0,00 | 0,00 | 0,58 | 15,25 | 0,5186 | 0,0197 | |||
| ESAB / ESAB Corporation | 0,00 | -1,09 | 0,58 | 2,30 | 0,5141 | -0,0432 | |||
| C / Citigroup Inc. | 0,01 | -9,14 | 0,53 | 8,98 | 0,4752 | -0,0087 | |||
| GEHC / GE HealthCare Technologies Inc. | 0,01 | 4,96 | 0,47 | -3,72 | 0,4154 | -0,0630 | |||
| ORLY / O'Reilly Automotive, Inc. | 0,00 | 1.219,15 | 0,45 | -16,91 | 0,3977 | -0,1339 | |||
| GWW / W.W. Grainger, Inc. | 0,00 | 0,00 | 0,43 | 5,37 | 0,3850 | -0,0206 | |||
| GSCE / GS Connect S&P GSCI Enhanced Commodity Total Return ETN | 0,00 | -1,95 | 0,43 | 27,08 | 0,3803 | 0,0482 | |||
| RKT / Rocket Companies, Inc. | 0,03 | -1,38 | 0,41 | 15,71 | 0,3612 | 0,0154 | |||
| AAPL / Apple Inc. | 0,00 | -1,85 | 0,40 | -9,23 | 0,3589 | -0,0803 | |||
| AMTM / Amentum Holdings, Inc. | 0,02 | 4,98 | 0,39 | 35,99 | 0,3504 | 0,0650 | |||
| TRGP / Targa Resources Corp. | 0,00 | 0,00 | 0,37 | -13,26 | 0,3324 | -0,0923 | |||
| ABNB / Airbnb, Inc. | 0,00 | 0,36 | 0,3222 | 0,3222 | |||||
| CRWD / CrowdStrike Holdings, Inc. | 0,00 | 0,00 | 0,36 | 44,76 | 0,3195 | 0,0741 | |||
| FIGS / FIGS, Inc. | 0,06 | -1,25 | 0,36 | 21,50 | 0,3168 | 0,0272 | |||
| MA / Mastercard Incorporated | 0,00 | -1,56 | 0,35 | 0,85 | 0,3155 | -0,0313 | |||
| PSX / Phillips 66 | 0,00 | -2,56 | 0,34 | -5,90 | 0,2985 | -0,0533 | |||
| TJX / The TJX Companies, Inc. | 0,00 | -8,76 | 0,27 | -7,56 | 0,2402 | -0,0479 | |||
| XOM / Exxon Mobil Corporation | 0,00 | -13,55 | 0,27 | -21,76 | 0,2375 | -0,0987 | |||
| WMT / Walmart Inc. | 0,00 | 0,67 | 0,26 | 11,86 | 0,2357 | 0,0025 | |||
| CGNG / Capital Group New Geography Equity ETF | 0,01 | 0,26 | 0,2333 | 0,2333 | |||||
| IBM / International Business Machines Corporation | 0,00 | 0,24 | 0,2111 | 0,2111 | |||||
| USB / U.S. Bancorp | 0,01 | -10,83 | 0,24 | -4,45 | 0,2105 | -0,0338 | |||
| BABA / Alibaba Group Holding Limited - Depositary Receipt (Common Stock) | 0,00 | -42,59 | 0,22 | -50,77 | 0,1986 | -0,2488 | |||
| INTC / Intel Corporation | 0,01 | -63,04 | 0,22 | -63,53 | 0,1968 | -0,4020 | |||
| COP / ConocoPhillips | 0,00 | 0,00 | 0,22 | -14,57 | 0,1936 | -0,0577 | |||
| COST / Costco Wholesale Corporation | 0,00 | -2,30 | 0,21 | 1,95 | 0,1867 | -0,0158 | |||
| MHK / Mohawk Industries, Inc. | 0,00 | -100,00 | 0,00 | 0,0000 | |||||
| JNJ / Johnson & Johnson | 0,00 | -100,00 | 0,00 | -100,00 | -0,2001 | ||||
| EPD / Enterprise Products Partners L.P. - Limited Partnership | 0,00 | -100,00 | 0,00 | 0,0000 | |||||
| KVUE / Kenvue Inc. | 0,00 | -100,00 | 0,00 | -100,00 | -0,2076 |