Statistiche di base
| Valore del portafoglio | $ 71.472 |
| Posizioni attuali | 83 |
Ultime partecipazioni, performance, AUM (da depositi 13F, 13D)
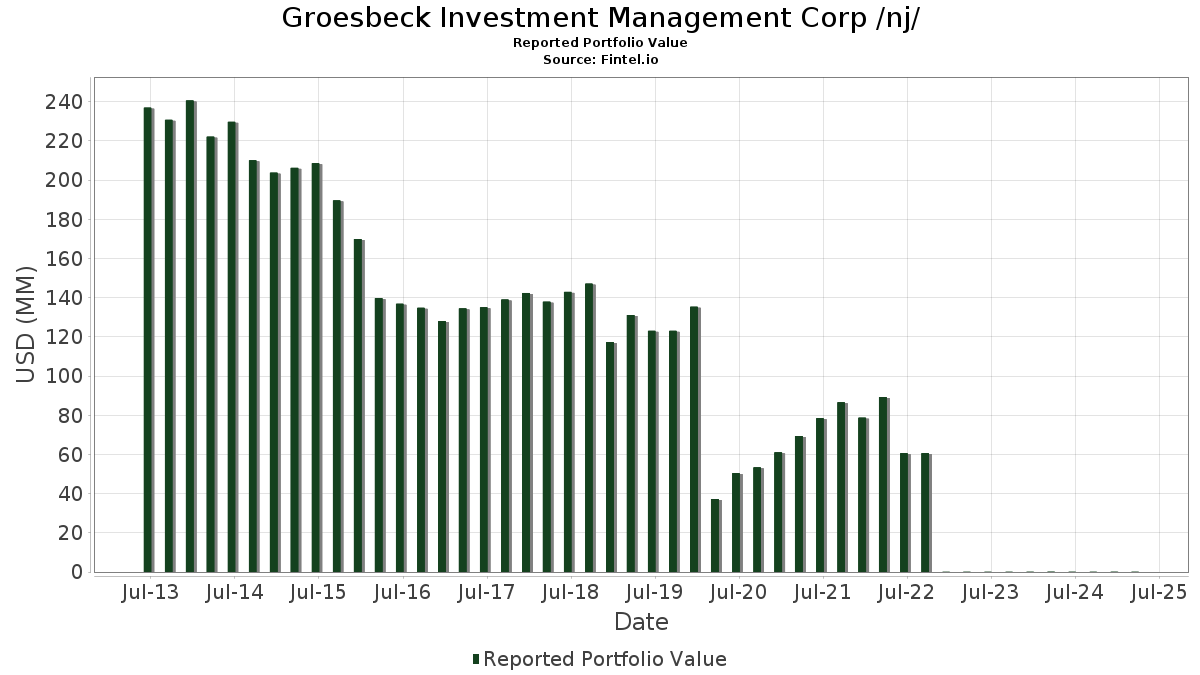
Groesbeck Investment Management Corp /nj/ ha dichiarato un totale di 83 partecipazioni negli ultimi documenti depositati presso la SEC. Il valore più recente del portafoglio è pari a $ 71.472 USD. Il patrimonio gestito effettivo (AUM) corrisponde a questo valore più la liquidità (che non viene dichiarata). Le principali partecipazioni di Groesbeck Investment Management Corp /nj/ sono AbbVie Inc. (US:ABBV) , Broadcom Inc. (US:AVGO) , United Rentals, Inc. (US:URI) , Apple Inc. (US:AAPL) , and Lam Research Corporation (US:LRCX) . Le nuove posizioni di Groesbeck Investment Management Corp /nj/ includono Owens Corning (US:OC) , .
Gli aumenti più importanti di questo trimestre
Utilizziamo la variazione dell'allocazione del portafoglio perché è l'indicatore più significativo. Le variazioni possono essere dovute a transazioni o a variazioni dei prezzi delle azioni.
| Titolo | Azioni (in milioni) |
Valore (in milioni di $) |
Portafoglio % | ΔPortafoglio % |
|---|---|---|---|---|
| 0,02 | 0,00 | 5,7323 | 1,2127 | |
| 0,00 | 0,00 | 2,5493 | 0,5879 | |
| 0,00 | 0,00 | 0,3820 | 0,3820 | |
| 0,00 | 0,00 | 1,5601 | 0,3427 | |
| 0,00 | 0,00 | 1,7937 | 0,2902 | |
| 0,00 | 0,00 | 1,2676 | 0,2883 | |
| 0,04 | 0,00 | 2,7409 | 0,2880 | |
| 0,01 | 0,00 | 1,3880 | 0,2876 | |
| 0,01 | 0,00 | 1,6440 | 0,2172 | |
| 0,02 | 0,00 | 1,2578 | 0,2121 |
Gli aumenti più importanti di questo trimestre
Utilizziamo la variazione dell'allocazione del portafoglio perché è l'indicatore più significativo. Le variazioni possono essere dovute a transazioni o a variazioni dei prezzi delle azioni.
| Titolo | Azioni (in milioni) |
Valore (in milioni di $) |
Portafoglio % | ΔPortafoglio % |
|---|---|---|---|---|
| 0,02 | 0,00 | 4,4171 | -1,8050 | |
| 0,01 | 0,00 | 1,5936 | -0,5199 | |
| 0,01 | 0,00 | 3,4783 | -0,5185 | |
| 0,00 | 0,00 | 4,2002 | -0,3922 | |
| 0,01 | 0,00 | 2,5828 | -0,3878 | |
| 0,01 | 0,00 | 1,2466 | -0,3869 | |
| 0,00 | 0,00 | 0,0000 | -0,3824 | |
| 0,01 | 0,00 | 2,1057 | -0,3199 | |
| 0,00 | 0,00 | 0,0000 | -0,2757 | |
| 0,01 | 0,00 | 1,3572 | -0,2530 |
13F e depositi di fondi
Questo modulo è stato depositato il 2025-04-29 per il periodo di riferimento 2025-03-31. Fai clic sull'icona del link per visualizzare la cronologia completa delle transazioni.
Esegui l'upgrade per sbloccare i dati premium ed esportarli in Excel ![]() .
.
| Titolo | Tipo | Prezzo medio dell'azione | Azioni (in milioni) |
ΔAzioni (%) |
ΔAzioni (%) |
Valore (in milioni di $) |
Portafoglio (%) |
ΔPortafoglio (%) |
|
|---|---|---|---|---|---|---|---|---|---|
| ABBV / AbbVie Inc. | 0,02 | 0,00 | 0,00 | 33,33 | 5,7323 | 1,2127 | |||
| AVGO / Broadcom Inc. | 0,02 | -8,63 | 0,00 | -25,00 | 4,4171 | -1,8050 | |||
| URI / United Rentals, Inc. | 0,00 | -4,45 | 0,00 | 0,00 | 4,2002 | -0,3922 | |||
| AAPL / Apple Inc. | 0,01 | -8,80 | 0,00 | -33,33 | 3,4783 | -0,5185 | |||
| LRCX / Lam Research Corporation | 0,03 | -3,22 | 0,00 | 0,00 | 3,1439 | 0,1434 | |||
| OKE / ONEOK, Inc. | 0,02 | 0,00 | 0,00 | 0,00 | 2,9900 | 0,1781 | |||
| MSFT / Microsoft Corporation | 0,01 | 0,00 | 0,00 | 0,00 | 2,8906 | -0,1268 | |||
| CDW / CDW Corporation | 0,01 | -3,68 | 0,00 | -50,00 | 2,7801 | -0,1333 | |||
| TSCO / Tractor Supply Company | 0,04 | 0,00 | 0,00 | 0,00 | 2,7409 | 0,2880 | |||
| DLR / Digital Realty Trust, Inc. | 0,01 | 0,00 | 0,00 | -50,00 | 2,5828 | -0,3878 | |||
| ORLY / O'Reilly Automotive, Inc. | 0,00 | 0,00 | 0,00 | 0,00 | 2,5493 | 0,5879 | |||
| NVDD / Direxion Shares ETF Trust - Direxion Daily NVDA Bear 1X Shares | 0,01 | 0,00 | 0,00 | 0,00 | 2,1057 | -0,3199 | |||
| TMO / Thermo Fisher Scientific Inc. | 0,00 | 0,00 | 0,00 | 0,00 | 2,0833 | 0,0583 | |||
| UNH / UnitedHealth Group Incorporated | 0,00 | -6,18 | 0,00 | 0,00 | 2,0260 | 0,0881 | |||
| FTNT / Fortinet, Inc. | 0,01 | 0,00 | 0,00 | 0,00 | 1,9728 | 0,1728 | |||
| SHW / The Sherwin-Williams Company | 0,00 | 0,00 | 0,00 | 0,00 | 1,9126 | 0,1815 | |||
| GSCE / GS Connect S&P GSCI Enhanced Commodity Total Return ETN | 0,00 | -8,39 | 0,00 | 0,00 | 1,8035 | -0,1136 | |||
| V / Visa Inc. | 0,00 | 0,00 | 0,00 | 0,00 | 1,7937 | 0,2902 | |||
| NXST / Nexstar Media Group, Inc. | 0,01 | -5,64 | 0,00 | 0,00 | 1,6440 | 0,2172 | |||
| ANET / Arista Networks Inc | 0,01 | 0,00 | 0,00 | 0,00 | 1,5936 | -0,5199 | |||
| CI / The Cigna Group | 0,00 | 0,00 | 0,00 | 1,5601 | 0,3427 | ||||
| ABT / Abbott Laboratories | 0,01 | 0,00 | 0,00 | 1,3880 | 0,2876 | ||||
| TROW / T. Rowe Price Group, Inc. | 0,01 | -3,58 | 0,00 | -100,00 | 1,3572 | -0,2530 | |||
| SSNC / SS&C Technologies Holdings, Inc. | 0,01 | 0,00 | 0,00 | 1,2704 | 0,1987 | ||||
| VRTX / Vertex Pharmaceuticals Incorporated | 0,00 | 0,00 | 0,00 | 1,2676 | 0,2883 | ||||
| MPLX / MPLX LP - Limited Partnership | 0,02 | 0,00 | 0,00 | 1,2578 | 0,2121 | ||||
| ESNT / Essent Group Ltd. | 0,02 | 0,00 | 0,00 | 1,2564 | 0,1548 | ||||
| THO / THOR Industries, Inc. | 0,01 | -10,41 | 0,00 | -100,00 | 1,2466 | -0,3869 | |||
| ETR / Entergy Corporation | 0,01 | 0,00 | 0,00 | 1,1459 | 0,2017 | ||||
| META / Meta Platforms, Inc. | 0,00 | 0,00 | 0,00 | 1,1291 | 0,0626 | ||||
| PSA / Public Storage | 0,00 | 0,00 | 0,00 | 1,1249 | 0,0792 | ||||
| GOOGL / Alphabet Inc. | 0,00 | 0,00 | 0,00 | 1,0801 | -0,1437 | ||||
| MRK / Merck & Co., Inc. | 0,01 | -8,81 | 0,00 | 1,0578 | -0,1375 | ||||
| DBX / Dropbox, Inc. | 0,03 | 0,00 | 0,00 | 1,0536 | -0,0481 | ||||
| SO / The Southern Company | 0,01 | 0,00 | 0,00 | 1,0424 | 0,1749 | ||||
| DUK / Duke Energy Corporation | 0,01 | 0,00 | 0,00 | 0,9780 | 0,1742 | ||||
| KMB / Kimberly-Clark Corporation | 0,00 | 0,00 | 0,00 | 0,9682 | 0,1384 | ||||
| EPD / Enterprise Products Partners L.P. - Limited Partnership | 0,02 | 0,00 | 0,00 | 0,9472 | 0,1382 | ||||
| CVI / CVR Energy, Inc. | 0,03 | 0,00 | 0,00 | 0,9234 | 0,0949 | ||||
| PANW / Palo Alto Networks, Inc. | 0,00 | 0,00 | 0,00 | 0,9094 | 0,0081 | ||||
| CFR / Cullen/Frost Bankers, Inc. | 0,00 | -10,64 | 0,00 | 0,8717 | -0,1012 | ||||
| LHX / L3Harris Technologies, Inc. | 0,00 | 0,00 | 0,00 | 0,8199 | 0,0538 | ||||
| O / Realty Income Corporation | 0,01 | 0,00 | 0,00 | 0,7961 | 0,1146 | ||||
| AMGN / Amgen Inc. | 0,00 | -13,00 | 0,00 | 0,7793 | 0,0835 | ||||
| ENB / Enbridge Inc. | 0,01 | 0,00 | 0,00 | 0,7569 | 0,0832 | ||||
| GOOGL / Alphabet Inc. | 0,00 | 0,00 | 0,00 | 0,7569 | -0,1054 | ||||
| AVA / Avista Corporation | 0,01 | 0,00 | 0,00 | 0,7429 | 0,1395 | ||||
| OZK / Bank OZK | 0,01 | -10,04 | 0,00 | 0,7192 | -0,0430 | ||||
| ICE / Intercontinental Exchange, Inc. | 0,00 | -13,91 | 0,00 | 0,6576 | 0,0450 | ||||
| TMUS / T-Mobile US, Inc. | 0,00 | -16,73 | 0,00 | 0,6366 | 0,0487 | ||||
| SNY / Sanofi - Depositary Receipt (Common Stock) | 0,01 | 0,00 | 0,00 | 0,6310 | 0,1199 | ||||
| 0LIB / Ulta Beauty, Inc. | 0,00 | 0,00 | 0,00 | 0,6184 | -0,0631 | ||||
| VZ / Verizon Communications Inc. | 0,01 | 0,00 | 0,00 | 0,5737 | 0,1028 | ||||
| KR / The Kroger Co. | 0,01 | -20,11 | 0,00 | 0,5695 | -0,0288 | ||||
| MCK / McKesson Corporation | 0,00 | 0,00 | 0,00 | 0,5653 | 0,1204 | ||||
| AMZN / Amazon.com, Inc. | 0,00 | 0,00 | 0,00 | 0,5625 | -0,0410 | ||||
| BLK / BlackRock, Inc. | 0,00 | -19,51 | 0,00 | 0,5625 | -0,1412 | ||||
| HD / The Home Depot, Inc. | 0,00 | -16,79 | 0,00 | 0,5611 | -0,1049 | ||||
| DOX / Amdocs Limited | 0,00 | -13,02 | 0,00 | 0,5527 | 0,0038 | ||||
| NGG / National Grid plc - Depositary Receipt (Common Stock) | 0,01 | 0,00 | 0,00 | 0,5443 | 0,0852 | ||||
| CARR / Carrier Global Corporation | 0,01 | -17,30 | 0,00 | 0,5359 | -0,1118 | ||||
| ZTS / Zoetis Inc. | 0,00 | 0,00 | 0,00 | 0,5331 | 0,0427 | ||||
| ADBE / Adobe Inc. | 0,00 | -9,88 | 0,00 | 0,4897 | -0,0956 | ||||
| BCZ / TELUS Corporation | 0,02 | 0,00 | 0,00 | 0,4897 | 0,0592 | ||||
| CTRE / CareTrust REIT, Inc. | 0,01 | 0,00 | 0,00 | 0,4883 | 0,0591 | ||||
| WSO / Watsco, Inc. | 0,00 | 0,00 | 0,00 | 0,4883 | 0,0656 | ||||
| DKS / DICK'S Sporting Goods, Inc. | 0,00 | 0,00 | 0,00 | 0,4715 | -0,0266 | ||||
| ICLR / ICON Public Limited Company | 0,00 | 0,00 | 0,00 | 0,4673 | -0,0542 | ||||
| SBRA / Sabra Health Care REIT, Inc. | 0,02 | 0,00 | 0,00 | 0,4477 | 0,0341 | ||||
| D / Dominion Energy, Inc. | 0,01 | 0,00 | 0,00 | 0,4267 | 0,0457 | ||||
| FIVE / Five Below, Inc. | 0,00 | 0,00 | 0,00 | 0,4016 | -0,1213 | ||||
| NFLX / Netflix, Inc. | 0,00 | 0,00 | 0,00 | 0,3918 | 0,0445 | ||||
| OC / Owens Corning | 0,00 | 0,00 | 0,3820 | 0,3820 | |||||
| JNJ / Johnson & Johnson | 0,00 | 0,00 | 0,00 | 0,3708 | 0,0703 | ||||
| EBAY / eBay Inc. | 0,00 | -24,10 | 0,00 | 0,3694 | -0,0442 | ||||
| ALLE / Allegion plc | 0,00 | -19,85 | 0,00 | 0,3694 | -0,0598 | ||||
| MS / Morgan Stanley | 0,00 | 0,00 | 0,00 | 0,3596 | -0,0007 | ||||
| SBUX / Starbucks Corporation | 0,00 | -16,76 | 0,00 | 0,3400 | -0,0138 | ||||
| LMT / Lockheed Martin Corporation | 0,00 | -22,84 | 0,00 | 0,3358 | -0,1038 | ||||
| ALL / The Allstate Corporation | 0,00 | -24,18 | 0,00 | 0,3344 | -0,0467 | ||||
| POJN / Prologis, Inc. | 0,00 | -23,73 | 0,00 | 0,2938 | -0,0456 | ||||
| PH / Parker-Hannifin Corporation | 0,00 | 0,00 | 0,00 | 0,2868 | 0,0085 | ||||
| ELME / Elme Communities | 0,01 | 0,00 | 0,00 | 0,2435 | 0,0445 | ||||
| G / Genpact Limited | 0,00 | -100,00 | 0,00 | 0,0000 | -0,2757 | ||||
| ACN / Accenture plc | 0,00 | -100,00 | 0,00 | 0,0000 | -0,3824 | ||||
| GWW / W.W. Grainger, Inc. | 0,00 | -100,00 | 0,00 | 0,0000 | |||||
| EW / Edwards Lifesciences Corporation | 0,00 | -100,00 | 0,00 | 0,0000 | |||||
| BCRH / Blue Capital Reinsurance Holdings Ltd. | 0,03 | 0,00 | 0,00 | 0,0000 | 0,0000 |