Statistiche di base
| Valore del portafoglio | $ 258.353.015 |
| Posizioni attuali | 62 |
Ultime partecipazioni, performance, AUM (da depositi 13F, 13D)
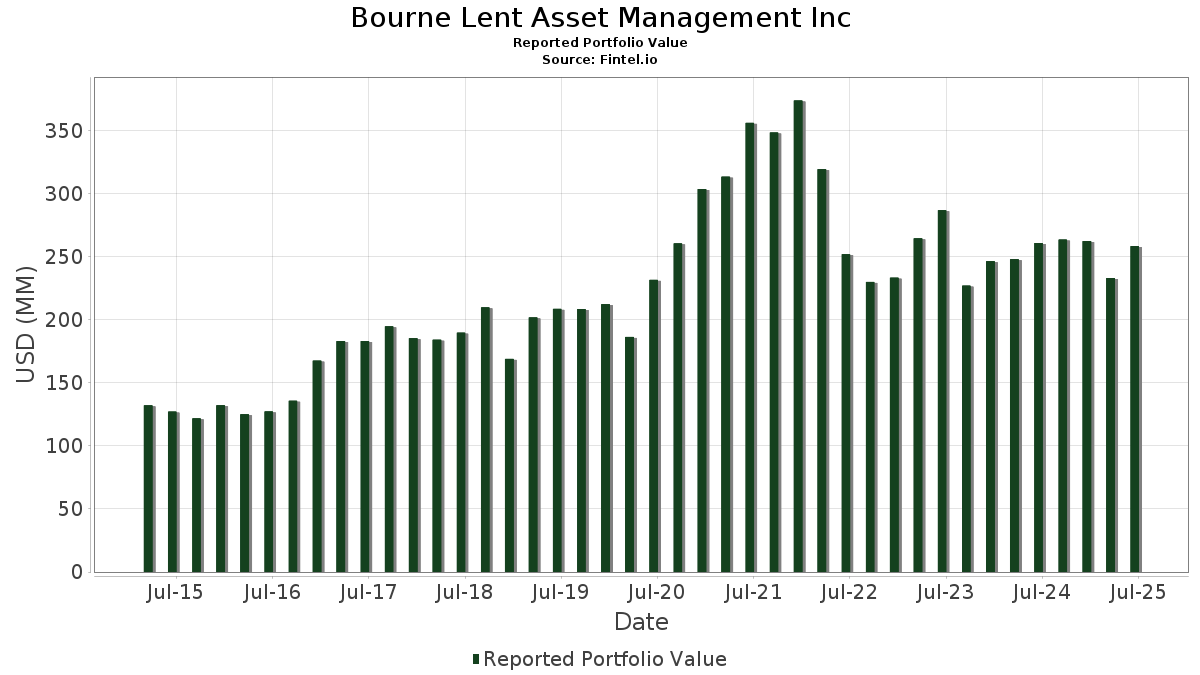
Bourne Lent Asset Management Inc ha dichiarato un totale di 62 partecipazioni negli ultimi documenti depositati presso la SEC. Il valore più recente del portafoglio è pari a $ 258.353.015 USD. Il patrimonio gestito effettivo (AUM) corrisponde a questo valore più la liquidità (che non viene dichiarata). Le principali partecipazioni di Bourne Lent Asset Management Inc sono Microsoft Corporation (US:MSFT) , Apple Inc. (US:AAPL) , Adobe Inc. (US:ADBE) , Alphabet Inc. (US:GOOG) , and Alphabet Inc. (US:GOOGL) . Le nuove posizioni di Bourne Lent Asset Management Inc includono Loar Holdings Inc. (US:LOAR) , AeroVironment, Inc. (US:AVAV) , .
Gli aumenti più importanti di questo trimestre
Utilizziamo la variazione dell'allocazione del portafoglio perché è l'indicatore più significativo. Le variazioni possono essere dovute a transazioni o a variazioni dei prezzi delle azioni.
| Titolo | Azioni (in milioni) |
Valore (in milioni di $) |
Portafoglio % | ΔPortafoglio % |
|---|---|---|---|---|
| 0,07 | 36,97 | 14,3101 | 2,3095 | |
| 0,03 | 11,37 | 4,4020 | 1,0006 | |
| 0,03 | 16,95 | 6,5595 | 0,8296 | |
| 0,09 | 3,43 | 1,3287 | 0,5626 | |
| 0,02 | 2,76 | 1,0680 | 0,2954 | |
| 0,11 | 18,95 | 7,3368 | 0,2000 | |
| 0,11 | 20,09 | 7,7771 | 0,1750 | |
| 0,01 | 1,38 | 0,5329 | 0,1672 | |
| 0,04 | 0,93 | 0,3589 | 0,1409 | |
| 0,01 | 0,79 | 0,3057 | 0,1334 |
Gli aumenti più importanti di questo trimestre
Utilizziamo la variazione dell'allocazione del portafoglio perché è l'indicatore più significativo. Le variazioni possono essere dovute a transazioni o a variazioni dei prezzi delle azioni.
| Titolo | Azioni (in milioni) |
Valore (in milioni di $) |
Portafoglio % | ΔPortafoglio % |
|---|---|---|---|---|
| 0,13 | 27,24 | 10,5428 | -2,0860 | |
| 0,13 | 6,14 | 2,3766 | -1,1584 | |
| 0,06 | 21,72 | 8,4078 | -0,8656 | |
| 0,06 | 8,07 | 3,1242 | -0,5600 | |
| 0,00 | 2,92 | 1,1284 | -0,2419 | |
| 0,00 | 3,05 | 1,1789 | -0,2056 | |
| 0,01 | 2,17 | 0,8414 | -0,1726 | |
| 0,01 | 2,89 | 1,1175 | -0,1684 | |
| 0,03 | 5,47 | 2,1188 | -0,1636 | |
| 0,03 | 2,75 | 1,0650 | -0,1340 |
13F e depositi di fondi
Questo modulo è stato depositato il 2025-07-08 per il periodo di riferimento 2025-06-30. Fai clic sull'icona del link per visualizzare la cronologia completa delle transazioni.
Esegui l'upgrade per sbloccare i dati premium ed esportarli in Excel ![]() .
.
| Titolo | Tipo | Prezzo medio dell'azione | Azioni (in milioni) |
ΔAzioni (%) |
ΔAzioni (%) |
Valore (in milioni di $) |
Portafoglio (%) |
ΔPortafoglio (%) |
|
|---|---|---|---|---|---|---|---|---|---|
| MSFT / Microsoft Corporation | 0,07 | -0,25 | 36,97 | 32,18 | 14,3101 | 2,3095 | |||
| AAPL / Apple Inc. | 0,13 | 0,18 | 27,24 | -7,46 | 10,5428 | -2,0860 | |||
| ADBE / Adobe Inc. | 0,06 | -0,37 | 21,72 | 0,50 | 8,4078 | -0,8656 | |||
| GOOG / Alphabet Inc. | 0,11 | -0,13 | 20,09 | 13,40 | 7,7771 | 0,1750 | |||
| GOOGL / Alphabet Inc. | 0,11 | -0,01 | 18,95 | 13,95 | 7,3368 | 0,2000 | |||
| IDXX / IDEXX Laboratories, Inc. | 0,03 | -0,64 | 16,95 | 26,89 | 6,5595 | 0,8296 | |||
| ISRG / Intuitive Surgical, Inc. | 0,03 | 0,00 | 14,53 | 9,72 | 5,6223 | -0,0576 | |||
| PWR / Quanta Services, Inc. | 0,03 | -3,56 | 11,37 | 43,46 | 4,4020 | 1,0006 | |||
| PAYX / Paychex, Inc. | 0,06 | -0,31 | 8,07 | -6,01 | 3,1242 | -0,5600 | |||
| CSCO / Cisco Systems, Inc. | 0,11 | -0,44 | 7,73 | 11,94 | 2,9934 | 0,0292 | |||
| BMY / Bristol-Myers Squibb Company | 0,13 | -1,81 | 6,14 | -25,49 | 2,3766 | -1,1584 | |||
| AMZN / Amazon.com, Inc. | 0,03 | 1,49 | 5,96 | 17,02 | 2,3072 | 0,1220 | |||
| QCOM / QUALCOMM Incorporated | 0,03 | -0,75 | 5,47 | 2,90 | 2,1188 | -0,1636 | |||
| ENB / Enbridge Inc. | 0,09 | 4,50 | 3,94 | 6,89 | 1,5261 | -0,0565 | |||
| SYM / Symbotic Inc. | 0,09 | 0,00 | 3,43 | 92,27 | 1,3287 | 0,5626 | |||
| LLY / Eli Lilly and Company | 0,00 | 0,00 | 3,05 | -5,61 | 1,1789 | -0,2056 | |||
| BRK.A / Berkshire Hathaway Inc. | 0,00 | 0,00 | 2,92 | -8,71 | 1,1284 | -0,2419 | |||
| AMGN / Amgen Inc. | 0,01 | 7,48 | 2,89 | -3,67 | 1,1175 | -0,1684 | |||
| V / Visa Inc. | 0,01 | 0,00 | 2,85 | 1,31 | 1,1041 | -0,1039 | |||
| MA / Mastercard Incorporated | 0,00 | 0,00 | 2,81 | 2,52 | 1,0871 | -0,0883 | |||
| NVDA / NVIDIA Corporation | 0,02 | 5,12 | 2,76 | 53,28 | 1,0680 | 0,2954 | |||
| UPS / United Parcel Service, Inc. | 0,03 | 7,28 | 2,75 | -1,54 | 1,0650 | -0,1340 | |||
| BKNG / Booking Holdings Inc. | 0,00 | 0,00 | 2,62 | 25,65 | 1,0129 | 0,1194 | |||
| JNJ / Johnson & Johnson | 0,01 | -0,14 | 2,17 | -8,04 | 0,8414 | -0,1726 | |||
| NTR / Nutrien Ltd. | 0,04 | 5,91 | 2,09 | 24,17 | 0,8078 | 0,0868 | |||
| TSLA / Tesla, Inc. | 0,01 | -7,38 | 1,99 | 13,56 | 0,7715 | 0,0182 | |||
| LHX / L3Harris Technologies, Inc. | 0,01 | 0,00 | 1,74 | 19,83 | 0,6738 | 0,0506 | |||
| BSX / Boston Scientific Corporation | 0,01 | -9,44 | 1,55 | -3,56 | 0,5986 | -0,0895 | |||
| PLTR / Palantir Technologies Inc. | 0,01 | 0,00 | 1,38 | 61,50 | 0,5329 | 0,1672 | |||
| PACB / Pacific Biosciences of California, Inc. | 0,97 | 0,00 | 1,21 | 5,06 | 0,4666 | -0,0256 | |||
| T / AT&T Inc. | 0,04 | 0,00 | 1,10 | 2,32 | 0,4276 | -0,0356 | |||
| PEG / Public Service Enterprise Group Incorporated | 0,01 | 0,00 | 0,93 | 2,31 | 0,3608 | -0,0302 | |||
| PFE / Pfizer Inc. | 0,04 | 90,75 | 0,93 | 82,48 | 0,3589 | 0,1409 | |||
| PEP / PepsiCo, Inc. | 0,01 | 77,46 | 0,85 | 56,27 | 0,3279 | 0,0953 | |||
| XOM / Exxon Mobil Corporation | 0,01 | 116,97 | 0,79 | 96,76 | 0,3057 | 0,1334 | |||
| LOW / Lowe's Companies, Inc. | 0,00 | 0,00 | 0,78 | -4,90 | 0,3006 | -0,0497 | |||
| GLD / SPDR Gold Trust | 0,00 | 0,00 | 0,72 | 5,70 | 0,2802 | -0,0134 | |||
| CNP / CenterPoint Energy, Inc. | 0,02 | 0,00 | 0,62 | 1,32 | 0,2384 | -0,0222 | |||
| MCHP / Microchip Technology Incorporated | 0,01 | 0,00 | 0,52 | 45,56 | 0,2031 | 0,0482 | |||
| HD / The Home Depot, Inc. | 0,00 | 0,00 | 0,49 | 0,00 | 0,1902 | -0,0205 | |||
| TROW / T. Rowe Price Group, Inc. | 0,01 | 0,00 | 0,49 | 4,95 | 0,1893 | -0,0105 | |||
| JPM / JPMorgan Chase & Co. | 0,00 | 0,00 | 0,45 | 18,16 | 0,1739 | 0,0108 | |||
| EOG / EOG Resources, Inc. | 0,00 | 15,38 | 0,45 | 7,69 | 0,1737 | -0,0052 | |||
| INTU / Intuit Inc. | 0,00 | 0,00 | 0,45 | 28,24 | 0,1726 | 0,0235 | |||
| EME / EMCOR Group, Inc. | 0,00 | 0,00 | 0,39 | 44,49 | 0,1524 | 0,0357 | |||
| GILD / Gilead Sciences, Inc. | 0,00 | 0,00 | 0,39 | -1,03 | 0,1493 | -0,0180 | |||
| MRK / Merck & Co., Inc. | 0,00 | 0,00 | 0,37 | -12,00 | 0,1451 | -0,0373 | |||
| BA / The Boeing Company | 0,00 | 12,90 | 0,37 | 38,64 | 0,1419 | 0,0285 | |||
| SO / The Southern Company | 0,00 | 0,00 | 0,36 | -0,28 | 0,1397 | -0,0154 | |||
| SYK / Stryker Corporation | 0,00 | 0,00 | 0,35 | 6,08 | 0,1354 | -0,0058 | |||
| ABT / Abbott Laboratories | 0,00 | 0,00 | 0,33 | 2,52 | 0,1262 | -0,0102 | |||
| IBM / International Business Machines Corporation | 0,00 | -8,70 | 0,31 | 8,42 | 0,1198 | -0,0029 | |||
| TMP / Tompkins Financial Corporation | 0,00 | 0,00 | 0,30 | -0,33 | 0,1174 | -0,0132 | |||
| PG / The Procter & Gamble Company | 0,00 | 0,00 | 0,30 | -6,52 | 0,1166 | -0,0217 | |||
| SLB / Schlumberger Limited | 0,01 | 0,00 | 0,29 | -19,26 | 0,1106 | -0,0410 | |||
| VZ / Verizon Communications Inc. | 0,01 | 4,44 | 0,29 | -0,35 | 0,1103 | -0,0124 | |||
| LFUS / Littelfuse, Inc. | 0,00 | 0,00 | 0,27 | 15,25 | 0,1053 | 0,0040 | |||
| ADP / Automatic Data Processing, Inc. | 0,00 | -4,71 | 0,25 | -3,86 | 0,0967 | -0,0147 | |||
| CAT / Caterpillar Inc. | 0,00 | 0,00 | 0,24 | 17,73 | 0,0929 | 0,0054 | |||
| LOAR / Loar Holdings Inc. | 0,00 | 0,22 | 0,0867 | 0,0867 | |||||
| INTC / Intel Corporation | 0,01 | -2,02 | 0,22 | -3,56 | 0,0843 | -0,0124 | |||
| AVAV / AeroVironment, Inc. | 0,00 | 0,20 | 0,0788 | 0,0788 | |||||
| RIO / Rio Tinto Group - Depositary Receipt (Common Stock) | 0,00 | -100,00 | 0,00 | 0,0000 |