Statistiche di base
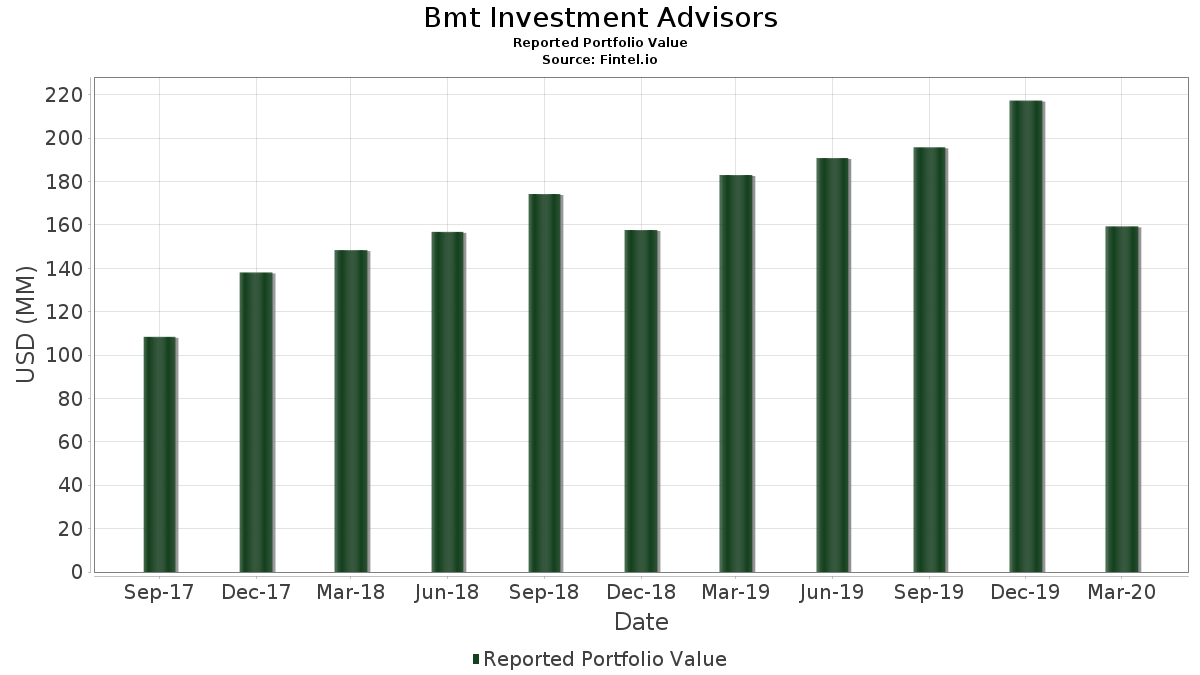
| Valore del portafoglio | $ 159.287.000 |
| Posizioni attuali | 80 |
Ultime partecipazioni, performance, AUM (da depositi 13F, 13D)
Bmt Investment Advisors ha dichiarato un totale di 80 partecipazioni negli ultimi documenti depositati presso la SEC. Il valore più recente del portafoglio è pari a $ 159.287.000 USD. Il patrimonio gestito effettivo (AUM) corrisponde a questo valore più la liquidità (che non viene dichiarata). Le principali partecipazioni di Bmt Investment Advisors sono Apple Inc. (US:AAPL) , Microsoft Corporation (US:MSFT) , Becton, Dickinson and Company (US:BDX) , JPMorgan Chase & Co. (US:JPM) , and Thermo Fisher Scientific Inc. (US:TMO) . Le nuove posizioni di Bmt Investment Advisors includono Norwegian Cruise Line Holdings Ltd. (US:NCLH) , .
Gli aumenti più importanti di questo trimestre
Utilizziamo la variazione dell'allocazione del portafoglio perché è l'indicatore più significativo. Le variazioni possono essere dovute a transazioni o a variazioni dei prezzi delle azioni.
| Titolo | Azioni (in milioni) |
Valore (in milioni di $) |
Portafoglio % | ΔPortafoglio % |
|---|---|---|---|---|
| 0,07 | 2,11 | 1,3272 | 1,3272 | |
| 0,02 | 1,78 | 1,1156 | 1,1156 | |
| 0,03 | 5,20 | 3,2627 | 0,8706 | |
| 0,02 | 6,03 | 3,7869 | 0,5806 | |
| 0,06 | 2,87 | 1,8030 | 0,5244 | |
| 0,02 | 2,78 | 1,7459 | 0,4880 | |
| 0,02 | 3,96 | 2,4848 | 0,4661 | |
| 0,01 | 2,50 | 1,5676 | 0,3847 | |
| 0,04 | 0,61 | 0,3823 | 0,3823 | |
| 0,02 | 2,42 | 1,5186 | 0,3744 |
Gli aumenti più importanti di questo trimestre
Utilizziamo la variazione dell'allocazione del portafoglio perché è l'indicatore più significativo. Le variazioni possono essere dovute a transazioni o a variazioni dei prezzi delle azioni.
| Titolo | Azioni (in milioni) |
Valore (in milioni di $) |
Portafoglio % | ΔPortafoglio % |
|---|---|---|---|---|
| 0,00 | 0,00 | -0,6729 | ||
| 0,02 | 0,59 | 0,3710 | -0,4570 | |
| 0,07 | 1,08 | 0,6812 | -0,4276 | |
| 0,04 | 1,69 | 1,0578 | -0,3957 | |
| 0,04 | 1,38 | 0,8689 | -0,3872 | |
| 0,03 | 1,45 | 0,9103 | -0,3766 | |
| 0,02 | 0,80 | 0,4991 | -0,3542 | |
| 0,05 | 1,48 | 0,9273 | -0,3472 | |
| 0,03 | 1,54 | 0,9687 | -0,3403 | |
| 0,02 | 1,14 | 0,7126 | -0,3332 |
13F e depositi di fondi
Questo modulo è stato depositato il 2020-04-23 per il periodo di riferimento 2020-03-31. Fai clic sull'icona del link per visualizzare la cronologia completa delle transazioni.
Esegui l'upgrade per sbloccare i dati premium ed esportarli in Excel ![]() .
.
| Titolo | Tipo | Prezzo medio dell'azione | Azioni (in milioni) |
ΔAzioni (%) |
ΔAzioni (%) |
Valore (in milioni di $) |
Portafoglio (%) |
ΔPortafoglio (%) |
|
|---|---|---|---|---|---|---|---|---|---|
| AAPL / Apple Inc. | 0,02 | 0,00 | 6,03 | -13,41 | 3,7869 | 0,5806 | |||
| MSFT / Microsoft Corporation | 0,03 | 0,00 | 5,20 | 0,00 | 3,2627 | 0,8706 | |||
| BDX / Becton, Dickinson and Company | 0,02 | 6,82 | 3,96 | -9,76 | 2,4848 | 0,4661 | |||
| JPM / JPMorgan Chase & Co. | 0,04 | 0,00 | 3,89 | -35,41 | 2,4421 | -0,3301 | |||
| TMO / Thermo Fisher Scientific Inc. | 0,01 | -3,63 | 3,77 | -15,86 | 2,3649 | 0,3043 | |||
| MA / Mastercard Incorporated | 0,02 | 0,00 | 3,64 | -19,09 | 2,2877 | 0,2146 | |||
| CACI / CACI International Inc | 0,02 | 0,00 | 3,36 | -15,54 | 2,1094 | 0,2784 | |||
| HRL / Hormel Foods Corporation | 0,06 | 0,00 | 2,87 | 3,38 | 1,8030 | 0,5244 | |||
| HON / Honeywell International Inc. | 0,02 | 0,00 | 2,87 | -24,41 | 1,7999 | 0,0541 | |||
| TFX / Teleflex Incorporated | 0,01 | 0,00 | 2,85 | -22,20 | 1,7861 | 0,1029 | |||
| ABT / Abbott Laboratories | 0,04 | 0,00 | 2,81 | -9,16 | 1,7629 | 0,3401 | |||
| LHCG / LHC Group Inc | 0,02 | 0,00 | 2,78 | 1,76 | 1,7459 | 0,4880 | |||
| TJX / The TJX Companies, Inc. | 0,06 | 0,00 | 2,71 | -21,69 | 1,7020 | 0,1085 | |||
| SSB / SouthState Corporation | 0,05 | 3,56 | 2,68 | -29,88 | 1,6838 | -0,0768 | |||
| VZ / Verizon Communications Inc. | 0,05 | 0,00 | 2,68 | -12,52 | 1,6806 | 0,2722 | |||
| GOOG / Alphabet Inc. | 0,00 | 0,00 | 2,65 | -13,01 | 1,6618 | 0,2612 | |||
| SWKS / Skyworks Solutions, Inc. | 0,03 | 0,00 | 2,62 | -26,07 | 1,6448 | 0,0136 | |||
| SYK / Stryker Corporation | 0,02 | 0,00 | 2,60 | -20,68 | 1,6329 | 0,1237 | |||
| NDSN / Nordson Corporation | 0,02 | 0,00 | 2,58 | -17,06 | 1,6178 | 0,1878 | |||
| GPN / Global Payments Inc. | 0,02 | 0,00 | 2,52 | -20,99 | 1,5833 | 0,1141 | |||
| MASI / Masimo Corporation | 0,01 | -13,28 | 2,50 | -2,84 | 1,5676 | 0,3847 | |||
| AMGN / Amgen Inc. | 0,01 | 0,00 | 2,43 | -15,90 | 1,5237 | 0,1953 | |||
| AWK / American Water Works Company, Inc. | 0,02 | 0,00 | 2,42 | -2,70 | 1,5186 | 0,3744 | |||
| CSCO / Cisco Systems, Inc. | 0,06 | 0,00 | 2,41 | -18,04 | 1,5142 | 0,1597 | |||
| ADI / Analog Devices, Inc. | 0,03 | 0,00 | 2,39 | -24,57 | 1,4998 | 0,0421 | |||
| JNJ / Johnson & Johnson | 0,02 | 0,00 | 2,38 | -10,10 | 1,4973 | 0,2762 | |||
| UPS / United Parcel Service, Inc. | 0,02 | 0,00 | 2,33 | -20,20 | 1,4634 | 0,1189 | |||
| PEP / PepsiCo, Inc. | 0,02 | 0,00 | 2,25 | -12,12 | 1,4107 | 0,2337 | |||
| PAYX / Paychex, Inc. | 0,03 | 0,00 | 2,18 | -26,01 | 1,3699 | 0,0125 | |||
| CHD / Church & Dwight Co., Inc. | 0,03 | 0,00 | 2,14 | -8,75 | 1,3422 | 0,2638 | |||
| TFC / Truist Financial Corporation | 0,07 | 0,00 | 2,11 | -45,25 | 1,3272 | 1,3272 | |||
| CRUS / Cirrus Logic, Inc. | 0,03 | 0,00 | 2,09 | -20,35 | 1,3096 | 0,1041 | |||
| NSC / Norfolk Southern Corporation | 0,01 | 0,00 | 2,04 | -24,80 | 1,2832 | 0,0322 | |||
| AUB / Atlantic Union Bankshares Corporation | 0,09 | 2,21 | 2,02 | -40,37 | 1,2694 | -0,2914 | |||
| GLW / Corning Incorporated | 0,10 | 0,00 | 2,01 | -29,44 | 1,2638 | -0,0494 | |||
| JCI / Johnson Controls International plc | 0,07 | 0,00 | 2,01 | -33,77 | 1,2631 | -0,1352 | |||
| MMS / Maximus, Inc. | 0,03 | 0,00 | 2,00 | -21,77 | 1,2587 | 0,0791 | |||
| UFPI / UFP Industries, Inc. | 0,05 | 3,88 | 1,99 | -19,01 | 1,2493 | 0,1184 | |||
| BRC / Brady Corporation | 0,04 | 0,00 | 1,82 | -21,18 | 1,1445 | 0,0799 | |||
| CBOE / Cboe Global Markets, Inc. | 0,02 | 0,00 | 1,79 | -25,64 | 1,1250 | 0,0158 | |||
| LOW / Lowe's Companies, Inc. | 0,02 | 5,63 | 1,78 | -24,09 | 1,1156 | 1,1156 | |||
| LH / Labcorp Holdings Inc. | 0,01 | 0,00 | 1,77 | -25,30 | 1,1087 | 0,0206 | |||
| CAC / Camden National Corporation | 0,06 | 0,00 | 1,75 | -31,70 | 1,0999 | -0,0807 | |||
| BMI / Badger Meter, Inc. | 0,03 | 0,00 | 1,75 | -17,44 | 1,0993 | 0,1230 | |||
| SYY / Sysco Corporation | 0,04 | 0,00 | 1,69 | -46,64 | 1,0578 | -0,3957 | |||
| RJF / Raymond James Financial, Inc. | 0,03 | 0,00 | 1,65 | -29,34 | 1,0371 | -0,0390 | |||
| ABM / ABM Industries Incorporated | 0,07 | 0,00 | 1,63 | -35,41 | 1,0227 | -0,1381 | |||
| AMCR / Amcor plc | 0,20 | 0,00 | 1,63 | -25,08 | 1,0221 | 0,0219 | |||
| KMB / Kimberly-Clark Corporation | 0,01 | 0,00 | 1,62 | -7,00 | 1,0170 | 0,2152 | |||
| SXI / Standex International Corporation | 0,03 | 0,00 | 1,60 | -38,23 | 1,0032 | -0,1875 | |||
| US2296691064 / Cubic Corporation | 0,04 | 0,00 | 1,60 | -35,00 | 1,0026 | -0,1283 | |||
| MKC / McCormick & Company, Incorporated | 0,01 | 0,00 | 1,59 | -16,84 | 0,9982 | 0,1182 | |||
| PRU / Prudential Financial, Inc. | 0,03 | 0,00 | 1,56 | -44,37 | 0,9800 | -0,3115 | |||
| SXT / Sensient Technologies Corporation | 0,04 | 0,00 | 1,55 | -34,14 | 0,9762 | -0,1105 | |||
| VFC / V.F. Corporation | 0,03 | 0,00 | 1,54 | -45,75 | 0,9687 | -0,3403 | |||
| SCHW / The Charles Schwab Corporation | 0,05 | 0,00 | 1,52 | -29,33 | 0,9574 | -0,0359 | |||
| ASTE / Astec Industries, Inc. | 0,04 | 0,00 | 1,50 | -16,74 | 0,9430 | 0,1126 | |||
| WFC / Wells Fargo & Company | 0,05 | 0,00 | 1,48 | -46,66 | 0,9273 | -0,3472 | |||
| APTV / Aptiv PLC | 0,03 | 0,00 | 1,45 | -48,14 | 0,9103 | -0,3766 | |||
| CVX / Chevron Corporation | 0,02 | 0,00 | 1,40 | -39,88 | 0,8802 | -0,1932 | |||
| WSM / Williams-Sonoma, Inc. | 0,03 | 0,00 | 1,40 | -42,09 | 0,8802 | -0,2342 | |||
| MMSI / Merit Medical Systems, Inc. | 0,04 | 0,00 | 1,40 | 0,07 | 0,8758 | 0,2342 | |||
| HXL / Hexcel Corporation | 0,04 | 0,00 | 1,38 | -49,29 | 0,8689 | -0,3872 | |||
| KWR / Quaker Chemical Corporation | 0,01 | -4,03 | 1,29 | -26,36 | 0,8086 | 0,0036 | |||
| BC / Brunswick Corporation | 0,03 | 0,00 | 1,20 | -41,03 | 0,7552 | -0,1837 | |||
| USPH / U.S. Physical Therapy, Inc. | 0,02 | 0,00 | 1,19 | -39,68 | 0,7483 | -0,1612 | |||
| DOW / Dow Inc. | 0,03 | 89,98 | 1,15 | 0,88 | 0,7232 | 0,1976 | |||
| DRI / Darden Restaurants, Inc. | 0,02 | 0,00 | 1,14 | -50,04 | 0,7126 | -0,3332 | |||
| AAWW / Atlas Air Worldwide Holdings Inc. | 0,04 | 0,00 | 1,13 | -6,90 | 0,7113 | 0,1511 | |||
| WWW / Wolverine World Wide, Inc. | 0,07 | 0,00 | 1,08 | -54,96 | 0,6812 | -0,4276 | |||
| US5537771033 / MTS Systems Corporation | 0,04 | 0,00 | 0,83 | -53,17 | 0,5192 | -0,2937 | |||
| EOG / EOG Resources, Inc. | 0,02 | 0,00 | 0,80 | -57,12 | 0,4991 | -0,3542 | |||
| XOM / Exxon Mobil Corporation | 0,02 | 0,00 | 0,76 | -45,55 | 0,4759 | -0,1648 | |||
| DORM / Dorman Products, Inc. | 0,01 | 0,00 | 0,73 | -26,93 | 0,4564 | -0,0016 | |||
| MOS / The Mosaic Company | 0,06 | 0,00 | 0,64 | -50,04 | 0,3999 | -0,1869 | |||
| AEO / American Eagle Outfitters, Inc. | 0,08 | 0,00 | 0,62 | -45,93 | 0,3917 | -0,1394 | |||
| / ViacomCBS Inc | 0,04 | 0,00 | 0,61 | -66,61 | 0,3823 | 0,3823 | |||
| SPR / Spirit AeroSystems Holdings, Inc. | 0,02 | 0,00 | 0,59 | -67,15 | 0,3710 | -0,4570 | |||
| SLB / Schlumberger Limited | 0,04 | 15,25 | 0,57 | -61,31 | 0,3585 | -0,3209 | |||
| NCLH / Norwegian Cruise Line Holdings Ltd. | 0,03 | 0,33 | 0,2091 | 0,2091 | |||||
| AVT / Avnet, Inc. | 0,00 | -100,00 | 0,00 | -100,00 | -0,6729 |