Statistiche di base
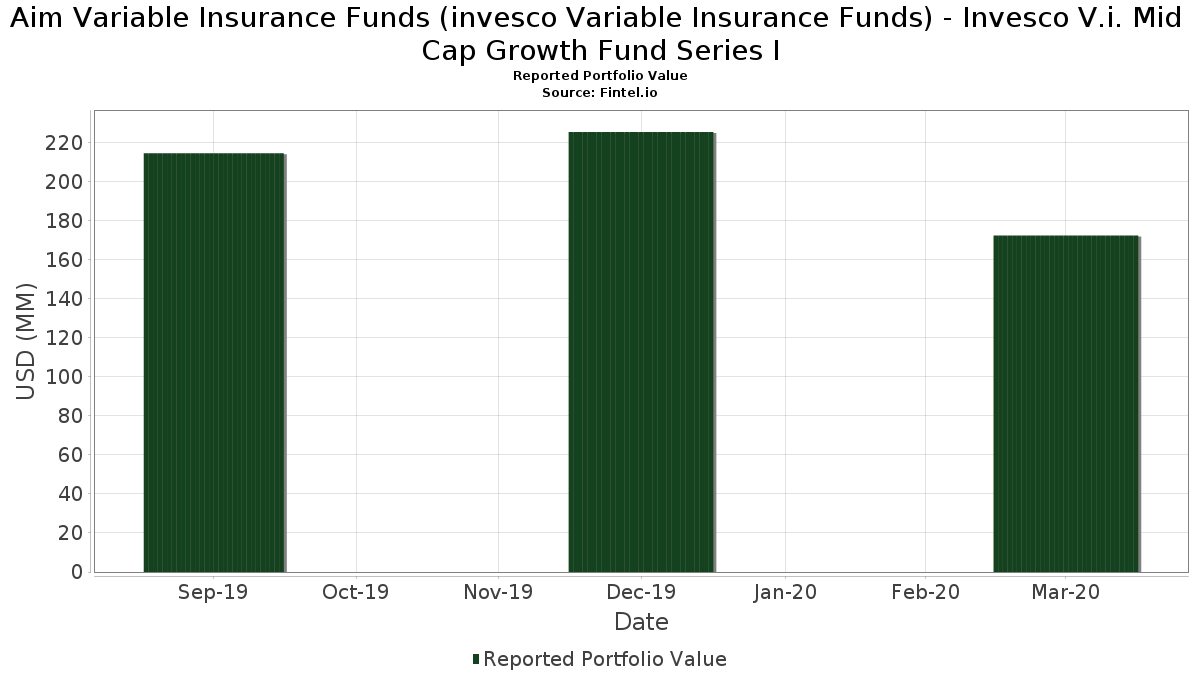
| Valore del portafoglio | $ 172.450.544 |
| Posizioni attuali | 90 |
Ultime partecipazioni, performance, AUM (da depositi 13F, 13D)
Aim Variable Insurance Funds (invesco Variable Insurance Funds) - Invesco V.i. Mid Cap Growth Fund Series I ha dichiarato un totale di 90 partecipazioni negli ultimi documenti depositati presso la SEC. Il valore più recente del portafoglio è pari a $ 172.450.544 USD. Il patrimonio gestito effettivo (AUM) corrisponde a questo valore più la liquidità (che non viene dichiarata). Le principali partecipazioni di Aim Variable Insurance Funds (invesco Variable Insurance Funds) - Invesco V.i. Mid Cap Growth Fund Series I sono DexCom, Inc. (US:DXCM) , RingCentral, Inc. (US:RNG) , CoStar Group, Inc. (US:CSGP) , Pool Corporation (US:POOL) , and Synopsys, Inc. (US:SNPS) . Le nuove posizioni di Aim Variable Insurance Funds (invesco Variable Insurance Funds) - Invesco V.i. Mid Cap Growth Fund Series I includono ResMed Inc. (US:RMD) , CACI International Inc (US:CACI) , D.R. Horton, Inc. (US:DHI) , Lamb Weston Holdings, Inc. (US:LW) , and Domino's Pizza, Inc. (US:DPZ) .
Gli aumenti più importanti di questo trimestre
Utilizziamo la variazione dell'allocazione del portafoglio perché è l'indicatore più significativo. Le variazioni possono essere dovute a transazioni o a variazioni dei prezzi delle azioni.
| Titolo | Azioni (in milioni) |
Valore (in milioni di $) |
Portafoglio % | ΔPortafoglio % |
|---|---|---|---|---|
| 0,02 | 2,53 | 1,4642 | 1,4642 | |
| 0,01 | 1,62 | 0,9399 | 0,9399 | |
| 0,02 | 4,96 | 2,8712 | 0,8057 | |
| 0,04 | 1,30 | 0,7540 | 0,7540 | |
| 0,02 | 3,09 | 1,7916 | 0,7309 | |
| 1,80 | 1,80 | 1,0440 | 0,7235 | |
| 0,01 | 2,95 | 1,7060 | 0,6944 | |
| 0,02 | 1,19 | 0,6909 | 0,6909 | |
| 0,00 | 1,18 | 0,6835 | 0,6835 | |
| 0,00 | 2,82 | 1,6303 | 0,6611 |
Gli aumenti più importanti di questo trimestre
Utilizziamo la variazione dell'allocazione del portafoglio perché è l'indicatore più significativo. Le variazioni possono essere dovute a transazioni o a variazioni dei prezzi delle azioni.
| Titolo | Azioni (in milioni) |
Valore (in milioni di $) |
Portafoglio % | ΔPortafoglio % |
|---|---|---|---|---|
| 0,00 | 0,81 | 0,4701 | -1,4217 | |
| 0,00 | 0,00 | -1,2419 | ||
| 0,01 | 1,77 | 1,0267 | -1,2315 | |
| 0,00 | 0,00 | -1,0921 | ||
| 0,00 | 0,00 | -1,0001 | ||
| 0,00 | 0,00 | -0,9387 | ||
| 0,02 | 1,52 | 0,8812 | -0,8845 | |
| 0,01 | 0,85 | 0,4897 | -0,8465 | |
| 0,00 | 0,00 | -0,7989 | ||
| 0,01 | 0,96 | 0,5539 | -0,7452 |
13F e depositi di fondi
Questo modulo è stato depositato il 2020-06-01 per il periodo di riferimento 2020-03-31. Fai clic sull'icona del link per visualizzare la cronologia completa delle transazioni.
Esegui l'upgrade per sbloccare i dati premium ed esportarli in Excel ![]() .
.
| Titolo | Tipo | Prezzo medio dell'azione | Azioni (in milioni) |
ΔAzioni (%) |
ΔAzioni (%) |
Valore (in milioni di $) |
Portafoglio (%) |
ΔPortafoglio (%) |
|
|---|---|---|---|---|---|---|---|---|---|
| DXCM / DexCom, Inc. | 0,02 | -13,53 | 4,96 | 6,44 | 2,8712 | 0,8057 | |||
| RNG / RingCentral, Inc. | 0,02 | -20,02 | 4,30 | 0,49 | 2,4919 | 0,5930 | |||
| CSGP / CoStar Group, Inc. | 0,01 | 0,13 | 3,96 | -1,71 | 2,2932 | 0,5065 | |||
| POOL / Pool Corporation | 0,02 | -1,07 | 3,87 | -8,34 | 2,2412 | 0,3690 | |||
| SNPS / Synopsys, Inc. | 0,03 | -9,45 | 3,75 | -16,23 | 2,1696 | 0,1867 | |||
| MSCI / MSCI Inc. | 0,01 | -17,20 | 3,72 | -7,33 | 2,1531 | 0,3741 | |||
| ROP / Roper Technologies, Inc. | 0,01 | 0,13 | 3,50 | -11,88 | 2,0278 | 0,2662 | |||
| MASI / Masimo Corporation | 0,02 | 15,41 | 3,09 | 29,29 | 1,7916 | 0,7309 | |||
| GPN / Global Payments Inc. | 0,02 | 26,44 | 2,99 | -0,10 | 1,7298 | 0,4038 | |||
| SBAC / SBA Communications Corporation | 0,01 | 15,27 | 2,95 | 29,10 | 1,7060 | 0,6944 | |||
| LULU / lululemon athletica inc. | 0,02 | -11,41 | 2,92 | -27,52 | 1,6913 | -0,0953 | |||
| TEAM / Atlassian Corporation | 0,02 | 0,13 | 2,92 | 14,20 | 1,6906 | 0,5571 | |||
| STE / STERIS plc | 0,02 | 25,06 | 2,90 | 14,85 | 1,6795 | 0,5597 | |||
| AMD / Advanced Micro Devices, Inc. | 0,06 | -21,25 | 2,89 | -21,90 | 1,6722 | 0,0327 | |||
| LRCX / Lam Research Corporation | 0,01 | -19,41 | 2,87 | -33,85 | 1,6598 | -0,2616 | |||
| CABO / Cable One, Inc. | 0,00 | 16,61 | 2,82 | 28,82 | 1,6303 | 0,6611 | |||
| KLAC / KLA Corporation | 0,02 | -27,80 | 2,77 | -41,76 | 1,6023 | -0,5041 | |||
| MPWR / Monolithic Power Systems, Inc. | 0,02 | 0,12 | 2,71 | -5,81 | 1,5662 | 0,2929 | |||
| RSG / Republic Services, Inc. | 0,04 | 0,13 | 2,70 | -16,14 | 1,5616 | 0,1356 | |||
| CMG / Chipotle Mexican Grill, Inc. | 0,00 | 0,15 | 2,61 | -21,70 | 1,5127 | 0,0333 | |||
| CDW / CDW Corporation | 0,03 | -2,77 | 2,61 | -36,51 | 1,5098 | -0,3112 | |||
| BAH / Booz Allen Hamilton Holding Corporation | 0,04 | 0,13 | 2,60 | -3,38 | 1,5051 | 0,3124 | |||
| WST / West Pharmaceutical Services, Inc. | 0,02 | 13,62 | 2,60 | 15,10 | 1,5047 | 0,5035 | |||
| SPLK / Splunk Inc. | 0,02 | 37,81 | 2,58 | 16,16 | 1,4939 | 0,5091 | |||
| RMD / ResMed Inc. | 0,02 | 2,53 | 1,4642 | 1,4642 | |||||
| TRU / TransUnion | 0,04 | 0,13 | 2,49 | -22,61 | 1,4392 | 0,0155 | |||
| EW / Edwards Lifesciences Corporation | 0,01 | 0,12 | 2,29 | -19,07 | 1,3250 | 0,0716 | |||
| AJG / Arthur J. Gallagher & Co. | 0,03 | -6,42 | 2,25 | -19,89 | 1,3038 | 0,0574 | |||
| TFX / Teleflex Incorporated | 0,01 | 36,88 | 2,25 | 6,50 | 1,3005 | 0,3654 | |||
| CPRT / Copart, Inc. | 0,03 | 0,13 | 2,21 | -24,56 | 1,2768 | -0,0191 | |||
| KSU / Kansas City Southern | 0,02 | 0,13 | 2,17 | -16,84 | 1,2552 | 0,0993 | |||
| ODFL / Old Dominion Freight Line, Inc. | 0,02 | 50,19 | 2,17 | 3,88 | 1,2552 | 0,3300 | |||
| ICLR / ICON Public Limited Company | 0,01 | 0,13 | 2,02 | -20,91 | 1,1711 | 0,0370 | |||
| FRC / First Republic Bank | 0,02 | 13,87 | 1,97 | -20,21 | 1,1429 | 0,0459 | |||
| AME / AMETEK, Inc. | 0,03 | 0,13 | 1,95 | -27,70 | 1,1273 | -0,0666 | |||
| ANSS / ANSYS, Inc. | 0,01 | 0,14 | 1,89 | -9,60 | 1,0957 | 0,1680 | |||
| BFAM / Bright Horizons Family Solutions Inc. | 0,02 | 0,12 | 1,87 | -32,06 | 1,0847 | -0,1376 | |||
| INFO / Harbor ETF Trust - Harbor PanAgora Dynamic Large Cap Core ETF | 0,03 | 0,13 | 1,84 | -20,29 | 1,0668 | 0,0423 | |||
| VEEV / Veeva Systems Inc. | 0,01 | -1,08 | 1,84 | 9,98 | 1,0662 | 0,3238 | |||
| EPAM / EPAM Systems, Inc. | 0,01 | 0,13 | 1,80 | -12,38 | 1,0445 | 0,1318 | |||
| US8252524066 / Invesco Treasury Portfolio, Institutional Class | 1,80 | 149,43 | 1,80 | 149,38 | 1,0440 | 0,7235 | |||
| ORLY / O'Reilly Automotive, Inc. | 0,01 | -49,32 | 1,77 | -65,19 | 1,0267 | -1,2315 | |||
| COUP / Coupa Software Inc | 0,01 | 0,13 | 1,76 | -4,30 | 1,0189 | 0,2034 | |||
| IEX / IDEX Corporation | 0,01 | -15,42 | 1,74 | -32,08 | 1,0064 | -0,1283 | |||
| CSL / Carlisle Companies Incorporated | 0,01 | 0,12 | 1,72 | -22,52 | 0,9985 | 0,0121 | |||
| MKTX / MarketAxess Holdings Inc. | 0,01 | 0,14 | 1,72 | -12,18 | 0,9984 | 0,1281 | |||
| CTAS / Cintas Corporation | 0,01 | -22,26 | 1,72 | -49,97 | 0,9969 | -0,5284 | |||
| BIO / Bio-Rad Laboratories, Inc. | 0,00 | -14,26 | 1,72 | -18,78 | 0,9944 | 0,0570 | |||
| ARE / Alexandria Real Estate Equities, Inc. | 0,01 | 0,12 | 1,66 | -15,08 | 0,9617 | 0,0947 | |||
| BURL / Burlington Stores, Inc. | 0,01 | 32,07 | 1,65 | -8,25 | 0,9532 | 0,1579 | |||
| CACI / CACI International Inc | 0,01 | 1,62 | 0,9399 | 0,9399 | |||||
| FMC / FMC Corporation | 0,02 | 43,20 | 1,62 | 17,17 | 0,9365 | 0,3246 | |||
| CBRE / CBRE Group, Inc. | 0,04 | 0,13 | 1,59 | -38,41 | 0,9204 | -0,2236 | |||
| US8252528851 / Invesco Government & Agency Portfolio, Institutional Class | 1,58 | 149,43 | 1,58 | 149,53 | 0,9135 | 0,6331 | |||
| TWLO / Twilio Inc. | 0,02 | 0,13 | 1,54 | -8,86 | 0,8938 | 0,1432 | |||
| TTD / The Trade Desk, Inc. | 0,01 | 18,45 | 1,52 | -12,02 | 0,8822 | 0,1146 | |||
| KEYS / Keysight Technologies, Inc. | 0,02 | -53,13 | 1,52 | -61,79 | 0,8812 | -0,8845 | |||
| MKC / McCormick & Company, Incorporated | 0,01 | -39,50 | 1,43 | -49,68 | 0,8270 | -0,4311 | |||
| PAYC / Paycom Software, Inc. | 0,01 | 0,14 | 1,43 | -23,61 | 0,8263 | -0,0018 | |||
| HLT / Hilton Worldwide Holdings Inc. | 0,02 | 13,29 | 1,36 | -30,28 | 0,7891 | -0,0777 | |||
| IDXX / IDEXX Laboratories, Inc. | 0,01 | -35,54 | 1,36 | -40,19 | 0,7876 | -0,2209 | |||
| LPLA / LPL Financial Holdings Inc. | 0,02 | -4,17 | 1,35 | -43,47 | 0,7795 | -0,2761 | |||
| GRMN / Garmin Ltd. | 0,02 | 48,83 | 1,34 | 14,38 | 0,7783 | 0,2572 | |||
| KKR / KKR & Co. Inc. | 0,06 | 0,13 | 1,34 | -19,42 | 0,7760 | 0,0385 | |||
| DHI / D.R. Horton, Inc. | 0,04 | 1,30 | 0,7540 | 0,7540 | |||||
| TW / Tradeweb Markets Inc. | 0,03 | 16,60 | 1,30 | 5,78 | 0,7523 | 0,2076 | |||
| BLL / Ball Corp. | 0,02 | -25,91 | 1,26 | -25,93 | 0,7282 | -0,0245 | |||
| LW / Lamb Weston Holdings, Inc. | 0,02 | 1,19 | 0,6909 | 0,6909 | |||||
| MLM / Martin Marietta Materials, Inc. | 0,01 | -17,09 | 1,19 | -43,89 | 0,6892 | -0,2514 | |||
| DPZ / Domino's Pizza, Inc. | 0,00 | 1,18 | 0,6835 | 0,6835 | |||||
| AVY / Avery Dennison Corporation | 0,01 | 27,73 | 1,15 | -0,52 | 0,6662 | 0,1533 | |||
| SGEN / Seagen Inc | 0,01 | 0,13 | 1,13 | 1,07 | 0,6541 | 0,1588 | |||
| BKI / Black Knight Inc - Class A | 0,02 | 2,58 | 1,09 | -2,43 | 0,6287 | 0,1096 | |||
| HSY / The Hershey Company | 0,01 | 1,08 | 0,6254 | 0,6254 | |||||
| EEFT / Euronet Worldwide, Inc. | 0,01 | -16,58 | 1,01 | -54,64 | 0,5869 | -0,4033 | |||
| DOCU / DocuSign, Inc. | 0,01 | 1,01 | 0,5852 | 0,5852 | |||||
| NXPI / NXP Semiconductors N.V. | 0,01 | -9,54 | 1,00 | -41,07 | 0,5794 | -0,1732 | |||
| WCN / Waste Connections, Inc. | 0,01 | -59,23 | 0,96 | -65,69 | 0,5539 | -0,7452 | |||
| PLNT / Planet Fitness, Inc. | 0,02 | -17,75 | 0,94 | -46,36 | 0,5419 | -0,2317 | |||
| ZNGA / Zynga Inc - Class A | 0,13 | 0,90 | 0,5182 | 0,5182 | |||||
| AYX / Alteryx, Inc. | 0,01 | 0,88 | 0,5101 | 0,5101 | |||||
| CNC / Centene Corporation | 0,01 | 0,86 | 0,5000 | 0,5000 | |||||
| MSI / Motorola Solutions, Inc. | 0,01 | -65,98 | 0,85 | -71,96 | 0,4897 | -0,8465 | |||
| NVCR / NovoCure Limited | 0,01 | 0,13 | 0,83 | -19,96 | 0,4785 | 0,0206 | |||
| ALNY / Alnylam Pharmaceuticals, Inc. | 0,01 | 0,82 | 0,4770 | 0,4770 | |||||
| MKSI / MKS Inc. | 0,01 | 0,82 | 0,4756 | 0,4756 | |||||
| TDG / TransDigm Group Incorporated | 0,00 | -66,72 | 0,81 | -80,97 | 0,4701 | -1,4217 | |||
| KMX / CarMax, Inc. | 0,01 | -17,13 | 0,76 | -49,13 | 0,4386 | -0,2214 | |||
| US8252527291 / Invesco Liquid Assets Portfolio, Institutional Class | 0,71 | 4,30 | 0,71 | 4,25 | 0,4119 | 0,0936 | |||
| TREX / Trex Company, Inc. | 0,01 | 0,41 | 0,2386 | 0,2386 | |||||
| TSN / Tyson Foods, Inc. | 0,00 | -100,00 | 0,00 | -100,00 | -0,5007 | ||||
| NDSN / Nordson Corporation | 0,00 | -100,00 | 0,00 | -100,00 | -0,4934 | ||||
| AZPN / Aspen Technology, Inc. | 0,00 | -100,00 | 0,00 | -100,00 | -0,6959 | ||||
| TECH / Bio-Techne Corporation | 0,00 | -100,00 | 0,00 | -100,00 | -0,7989 | ||||
| MAS / Masco Corporation | 0,00 | -100,00 | 0,00 | -100,00 | -0,9387 | ||||
| ATUS / Altice USA, Inc. | 0,00 | -100,00 | 0,00 | -100,00 | -0,0480 | ||||
| COO / The Cooper Companies, Inc. | 0,00 | -100,00 | 0,00 | -100,00 | -0,5154 | ||||
| APTV / Aptiv PLC | 0,00 | -100,00 | 0,00 | -100,00 | -0,7197 | ||||
| TSCO / Tractor Supply Company | 0,00 | -100,00 | 0,00 | -100,00 | -1,0001 | ||||
| ROKU / Roku, Inc. | 0,00 | -100,00 | 0,00 | -100,00 | -0,4175 | ||||
| LYV / Live Nation Entertainment, Inc. | 0,00 | -100,00 | 0,00 | -100,00 | -1,0921 | ||||
| IQV / IQVIA Holdings Inc. | 0,00 | -100,00 | 0,00 | -100,00 | -1,2419 |